Oil and gas software UX design agencyDesign for the10,000th well.
Product design, design systems and websites for upstream oil and gas software teams, from forecasting and type curves to economics, scheduling and the map. Learned over 3.5 years inside ComboCurve’s product team.
 By Ignat, founder of DIXI · Updated



What does an oil and gas software design agency do?
An oil and gas software design agency designs the products engineers use to forecast wells, run economics, book reserves and plan drilling, plus the websites that sell those products. DIXI does both. For 3.5 years we worked inside ComboCurve’s product team, designing features across forecasting, type curves, economics, scheduling, the map and the design system for a platform 400+ energy companies use.
- StudioDIXI, founder-led product and web design
- Founded2016
- BasedDnipro, Ukraine
- ClientsEnergy and B2B software teams in the US and Europe
- Oil and gas work3.5 years inside ComboCurve’s product team
- FormatsProjects from $12k · partner from $6k a month
Who do we design energy software for?
Two kinds of teams. Energy software companies, from Seed to Series B, building forecasting, economics, reserves, scheduling, mapping or data tools for operators, mineral buyers, banks and advisors. And product or digital teams inside energy companies replacing spreadsheets and desktop tools with internal apps. Both need designers who can sit with petroleum engineers, follow the workflow and keep up.
- Seed to Series B
Energy software companies
Forecasting, economics, reserves, scheduling, mapping and data products sold to operators, mineral buyers, banks and advisors.
- Reservoir engineers
- Reserves engineers
- A&D teams
- Analysts
- Internal tools
Digital teams at energy companies
Internal apps that replace spreadsheets and decades-old desktop tools, designed so engineers actually switch.
- Engineers
- Executives
- Auditors and banks
- IT and security
Why is oil and gas software hard to design?
Because engineers work in bulk, with long-held habits and expensive consequences. The US alone has about 918,000 producing wells, and one platform may forecast tens of thousands at once. Engineers learned ARIES and PHDwin over decades. Every forecast, NPV and schedule feeds a capital decision, so every assumption has to be visible, editable and traceable, at any scale.
Engineers work in bulk
About 918,000 producing wells in the US in 2024. A platform like ComboCurve auto-forecasts up to 25,000 wells in minutes, so every table, chart and selection has to work at that count.
Habits built over decades
ARIES dates from the late 1980s and PHDwin’s maker from 1986. Engineers know their shortcuts by heart, so a new tool has to feel familiar on day one and clearly faster by day two.
Every number is a capital decision
Forecasts, NPV and schedules decide where money goes. Even an automated forecast needs an engineer’s judgement, so inputs stay visible and every change is traceable.
Adoption decides the payback
Researchers at TGS argue that poor UX in energy software leads to inefficiencies, safety hazards and missed opportunities. If engineers work around a tool, it never pays back.
Sources: EIA, 2024 well count · ComboCore · Halliburton on ARIES · TGS, EAGE Digitalization Conference 2025.
What parts of upstream software do we design?
We design the workflows an engineer moves through between production data and a decision: forecasting and decline curve review, type curves, economics and scenarios, development scheduling, map-based well selection, and the data tables and charts underneath. We also build the design systems that keep those modules one product, and the websites that explain them to engineers, executives and IT.
| Workflow | What makes it hard | What we design | Where we’ve done it |
|---|---|---|---|
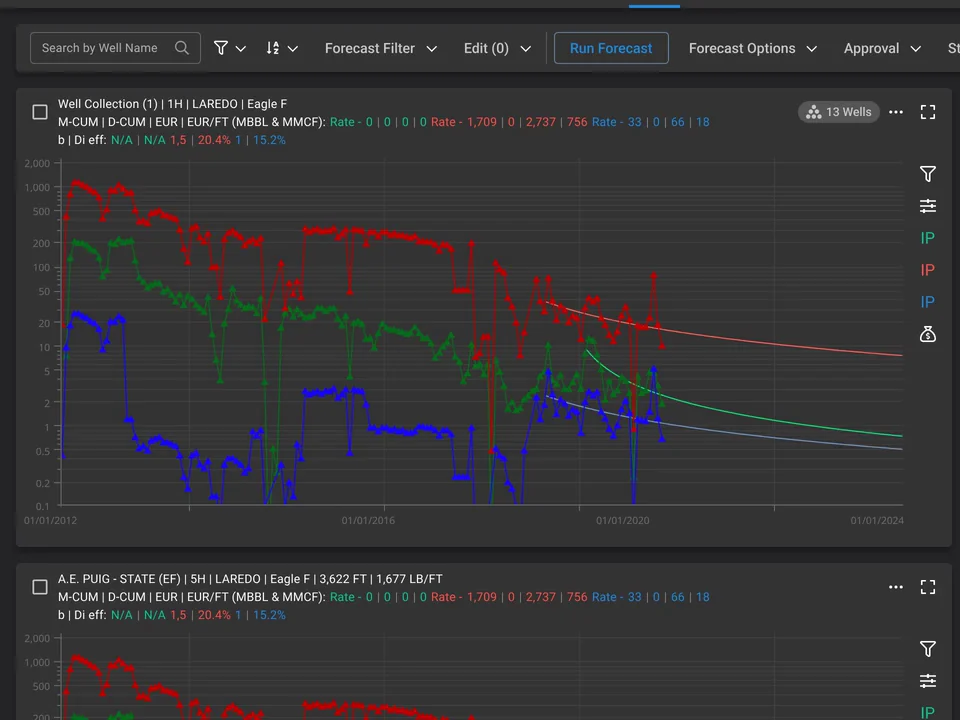
| Forecasting (decline curve analysis) | Thousands of wells, outliers, shut-in months, b-factor sensitivity | Bulk auto-forecast with a review queue; history and forecast on one log-scale chart, fit parameters beside it | ComboCurve features |
| Type curves | Choosing analog wells; P10, P50 and P90 cases | Analog selection from the map or the table, percentile overlays | ComboCurve features |
| Economics | Price decks, costs, ownership, many scenarios | Scenarios side by side, drill-down to the well, inputs one click from every result, exports for finance and banks | ComboCurve features |
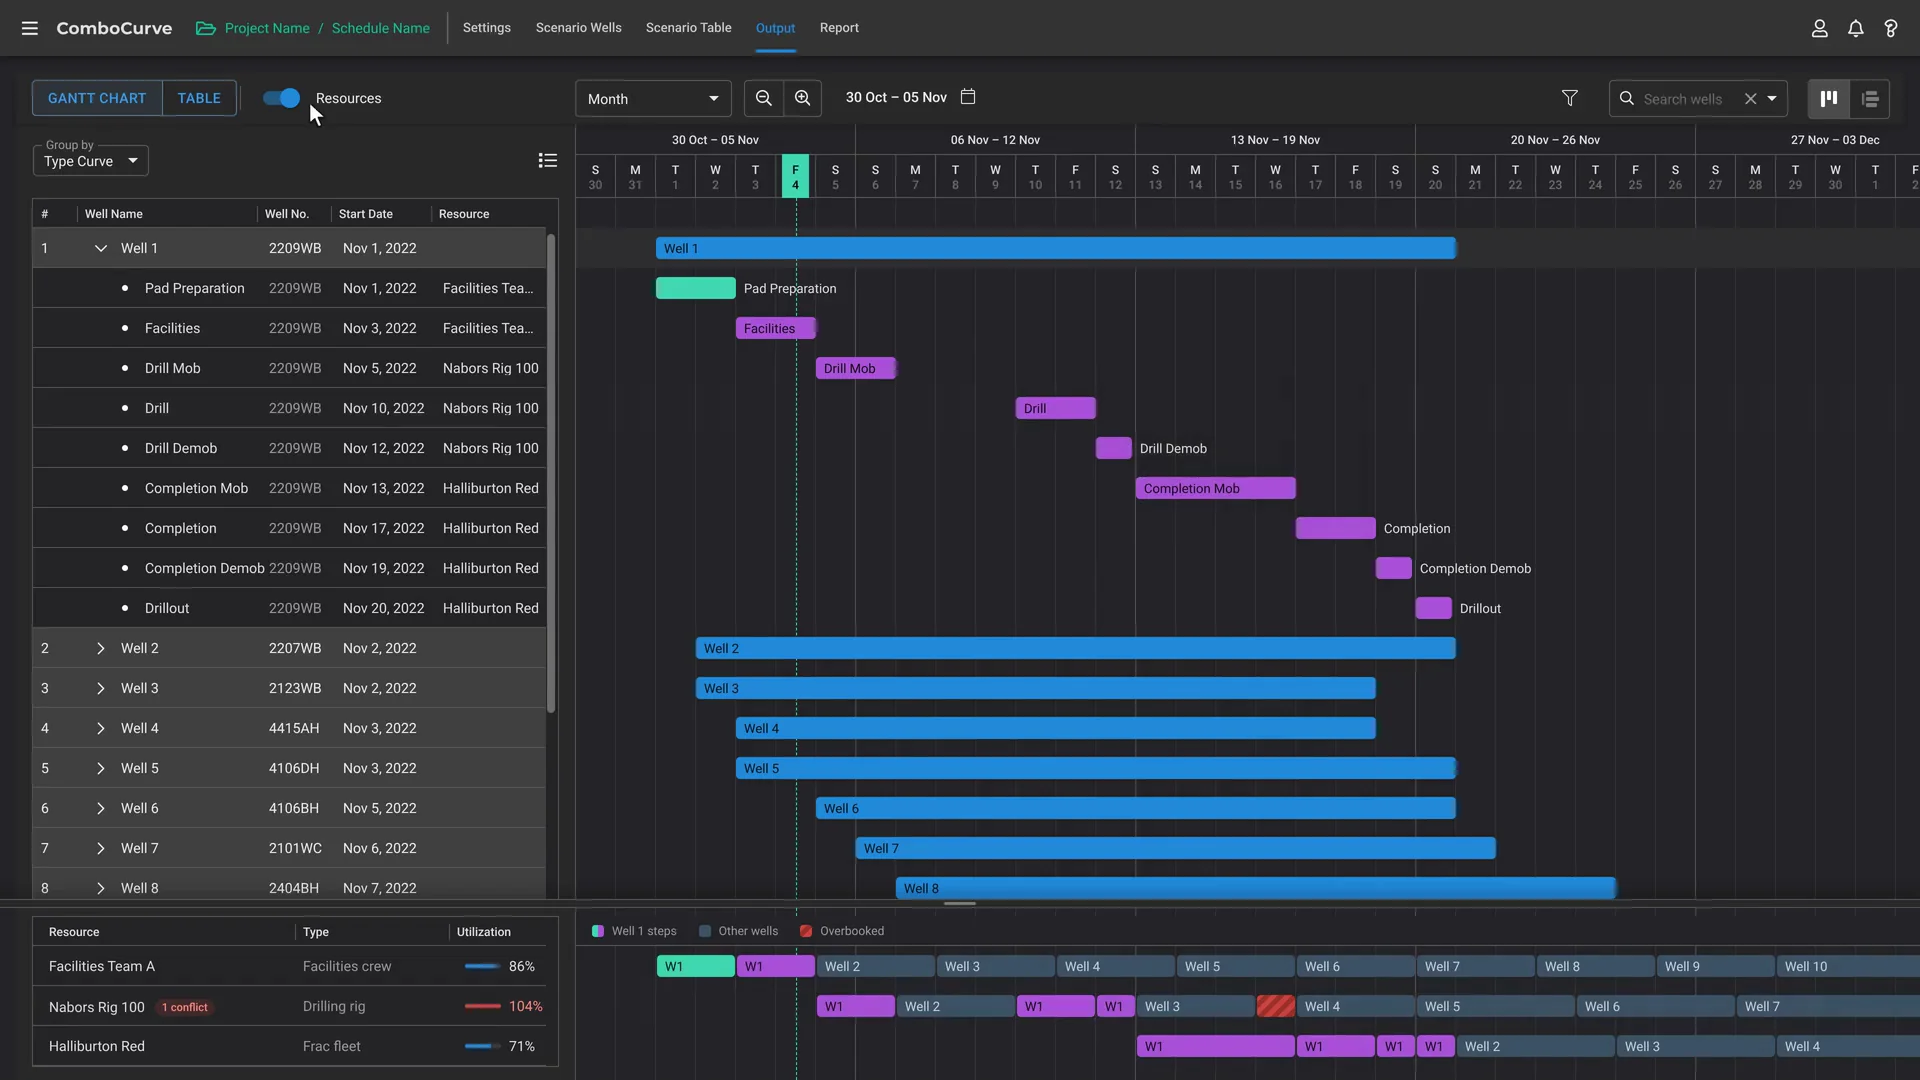
| Scheduling | Rigs, frac crews, pads, years of activity | A readable Gantt, custom activity steps, utilization with overbooked days flagged | ComboCurve features |
| Map and GIS | Basins, sections, offset wells | Laterals coloured by any attribute such as EUR; lasso and polygon selection synced with the well table | ComboCurve features |
| Reserves and audit trail | SEC and PRMS categories, reconciliation, sign-off | Category views, change history, reviewer flows | Same patterns; not a module we claim |
| Design system | Many modules, many teams shipping at once | Units and number formats, one data table, one chart grammar, one selection model | ComboCurve design system |
| Website | Engineers, executives and IT each need different answers | Role and use-case pages, the product in motion, proof above the fold, AI-search structure | ComboCurve website concept; B2B SaaS sites |
“ComboCurve features” means features we designed inside ComboCurve’s modules: complex workflows, everyday improvements and custom features for large customers, not whole modules from scratch.
How do you design software for petroleum engineers?
We start from the engineer’s workflow, not the screen, then apply three rules. Bulk first: selection, filters and bulk actions come before single-well views. The assumption sits next to the number: inputs stay one click from every result. Speak the engineer’s language: bbl/d, Mcf, b-factor, NRI, P90, not friendlier words that mean less.
Bulk first, then the single well
Engineers act on hundreds of wells at once and open one only when something looks wrong.
The assumption sits next to the number
A forecast, an NPV or a schedule is only as good as its inputs, so the inputs stay one click away.
Speak the engineer’s language
The industry’s own terms and units, from bbl/d to P90, on every screen.
- 01
Learn the engineering
Working sessions with your petroleum engineers: how they forecast, review and book, in their words and units.
- 02
Map the whole workflow
Forecast, type curve, economics and schedule designed as one path, so one module’s output is the next one’s input.
- 03
Design with real-scale data
Thousands of wells, missing values, long well names, mixed units and many scenarios side by side.
- 04
Ship with developers
Figma components, specs and every state, reviewed with developers during the build and checked after release.
What have we designed in oil and gas?
For 3.5 years DIXI worked inside ComboCurve’s product team, next to its engineers, developers and in-house designer. We designed features across forecasting and type curves, economics, scheduling and the map: complex new workflows, everyday improvements and custom features for large customers. We also built the design system the modules share. Over that period ComboCurve grew from 170+ to 400+ companies.

“Over 3 years of collaboration, Ignat played an important role in scaling the product and website while the company grew by 650%. He built our design system and improved key workflows for a platform trusted by 170+ companies.”
Isabel Ramos · UX Architect, ComboCurve
Client milestones are the work of ComboCurve’s whole team, of which design was one part.
Read the oil and gas software UX design case studyHow do you move engineers off ARIES, PHDwin and Excel?
By making the new tool feel familiar on day one and clearly faster by day two. Engineers have used ARIES since the late 1980s and PHDwin since its maker started in 1986, so we map their mental model first: cases, scenarios, price decks and exports. Then we keep the bridges, like Excel and Spotfire, while moving the work into shared browser workflows.
| Tool | Maker | What engineers rely on | What we keep in the new design |
|---|---|---|---|
| ARIES | Halliburton; in use since the late 1980s, now also a cloud app in DecisionSpace 365 | Per-well forecasts, economics and reserves reports | The case and scenario structure, price decks and the exports engineers trust |
| PHDwin | TRC Consultants, founded 1986 | Decline curves, economics and reserves | Keyboard speed and dense grids |
| Val Nav | Quorum | Decline curve analysis, petroleum economics and reserves management | Familiar reports and reconciliations |
| Excel and Spotfire | General-purpose tools | Custom analysis, charts and hand-offs between teams | Exports and imports both ways, so the bridges stay |
Sources: Halliburton, Quorum, ComboCurve case. Checked 31 October 2026.
What should a website for an energy software company do?
Explain a technical platform to every person who signs off on it. Engineers want to see the workflow and the units. Executives want time saved and faster decisions. IT and security want integrations, permissions and data handling. A good energy software website answers each of them on its own page, shows the real product and puts customer proof above the fold.
Who reads it, and what they need
- Engineers: the workflow, the units and the real product
- A&D and finance: how fast and how defensible an evaluation is
- Executives: time saved and faster decisions
- IT and security: integrations, permissions and data handling
- Banks and advisors: how results are produced and exported
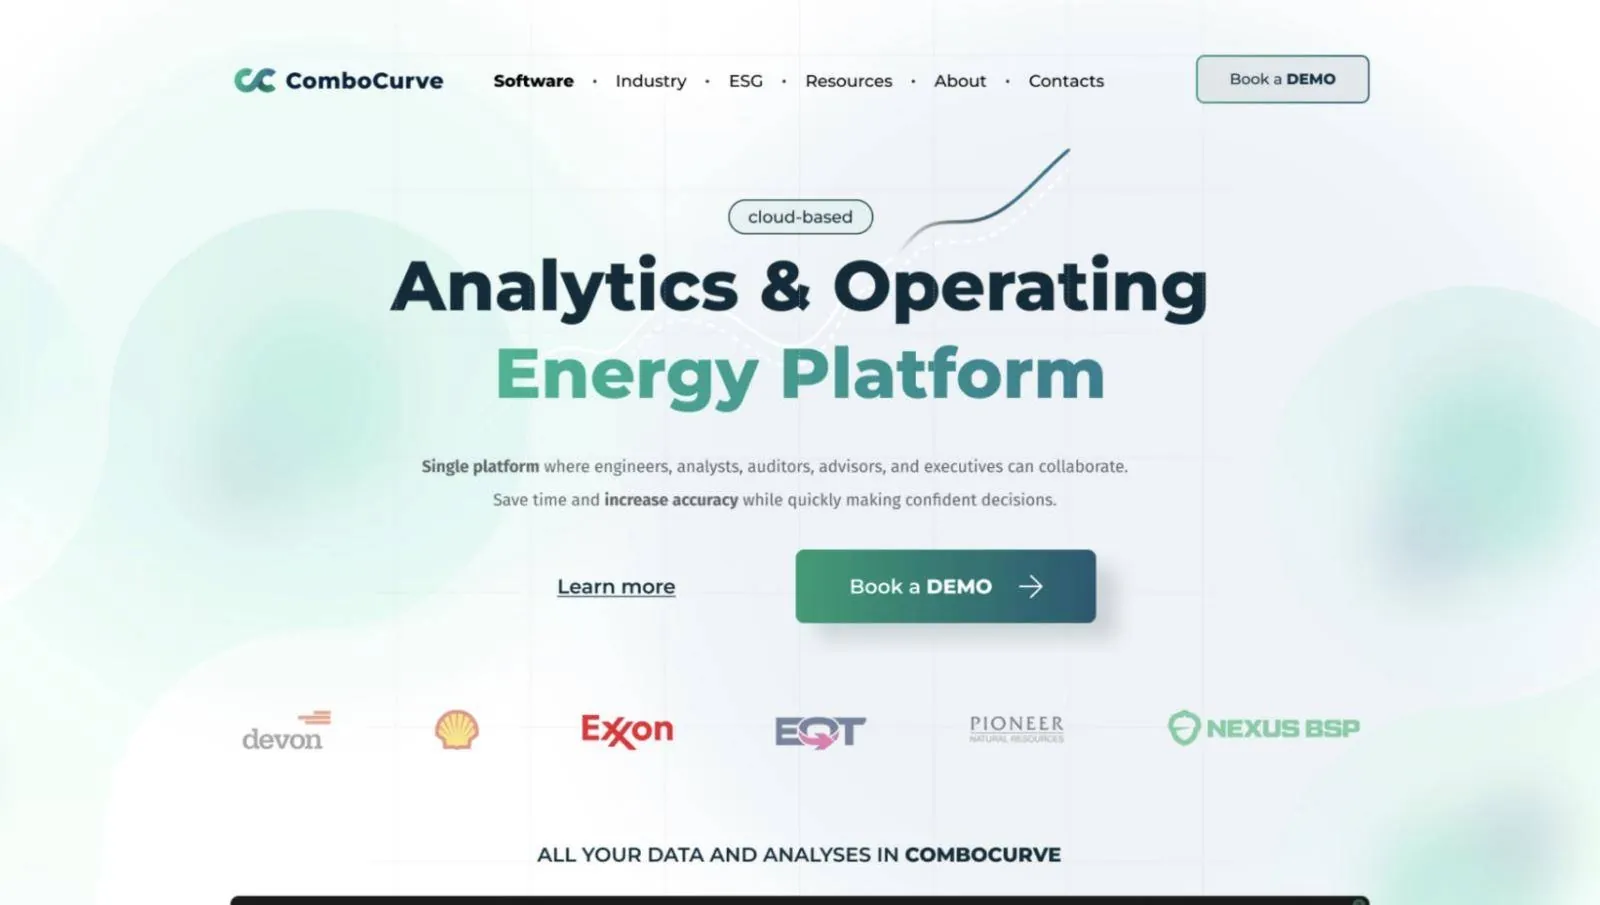
Our B2B websites delivered 3.2× qualified leads for Klik Solutions and 18% more demo bookings for an AI outbound platform.
B2B SaaS web designHow do you handle confidential well data and NDAs?
If you need an NDA, we sign it before the first working session. We treat production data, costs, ownership and customer workflows as confidential. We work inside your tools and accounts, use illustrative or anonymised data in anything shown outside your team, and publish only what you have cleared. In our ComboCurve case study, every diagram uses illustrative data and customer-specific features are described without names.
- NDA when you need itSigned before the first working session, on your paper or ours.
- Your tools, your accessWe work in your accounts, under your access controls.
- Illustrative data in publicAnything shown outside your team uses sample or anonymised data.
- Nothing published without sign-offCase studies show only what is public or cleared with you.
- Files and IP are yoursDesign files, components and code belong to you. Who owns the design and code
- Only your project teamYour data is seen only by the people working on your project.
How can we work together?
A design partner embeds senior design in your product team, the way we worked with ComboCurve. A project designs and builds a defined scope. A Conversion Sprint redesigns your highest-traffic page.
Audit and redesign of your homepage or key page: message, structure, proof.
- Audit of message, structure and proof
- Redesign of your homepage or key page
- Not included: Full website or product design
- Optional: Build and launch, as an add-on
- Not included: Design system your team can grow
- Not included: Experiments and monthly reviews
Full website or product redesign, with a design system your team can grow.
- Audit of message, structure and proof
- Redesign of your homepage or key page
- Full website or product design
- Development and launch
- Design system your team can grow
- Not included: Experiments and monthly reviews
Ongoing product and web design, experiments and monthly reviews.
- Audit of message, structure and proof
- Redesign of your homepage or key page
- Full website or product design
- Development and launch
- Design system your team can grow
- Experiments and monthly reviews
Need something custom?
A bigger scope, several services at once or a different timeline. We will shape the format and the price around your project.
Dev shop, energy web agency or product design studio: which fits?
Pick by where the hard part is. Software firms with oil and gas pages bring engineers and scale, but rarely show upstream design work. Energy web agencies build marketing sites for operators and service companies. Freelancers are flexible but cover one discipline. A product design studio fits when the hard part is the workflow itself: dense data, expert users and expensive decisions.
| Option | Published price | Timeline | Typical deliverables | Upstream design proof shown | Source |
|---|---|---|---|---|---|
| DIXI | Projects from $12k; partner from $6k a month; Sprint from $8k | Projects 6–10 weeks; partner month to month | Research, workflows, UI, design system, specs and every state, website design and build | 3.5 years inside ComboCurve | DIXI |
| Large dev shop with an oil and gas page | App MVP $50k–100k; enterprise $250k–500k | 3–9 months for an app | Roadmap, architecture, prototype, deployed software | None shown | TechAhead |
| Nearshore staff augmentation | $50–99 an hour; $10k+ minimum | Ongoing | Engineers and designers by the hour | None shown | Clutch |
| Energy website agency | Mid-market redesign about $15k–80k | 10–16 weeks for a focused redesign | Marketing site, CMS, investor and ESG sections | Mostly operators and utilities | RaftLabs |
| Design agency with an energy page | Not published | Not published | UX research, prototypes, design systems | Grid, storage, renewables, EV | Onething |
Third-party prices as published on each source, checked 31 October 2026: TechAhead, Clutch (Swovo profile), RaftLabs and Onething. All DIXI formats: see pricing.
Built with
Websites in Webflow, Framer, Astro and Shopify. Products in React, Next.js and React Native.
- Webflow
 Framer
 Astro
 Shopify
- React
- Next.js
- React Native
- Swift
 Figma
- Cloudflare

Work directly with the founder
I'm Ignat, and you work with me directly: no account managers and no handoffs, just a senior team that designs and builds your site.
 Ignat · Founder
Do you already know the oil and gas domain, or will we have to teach you?
We arrive knowing the vocabulary and the workflow: decline curves, type curves, P10, P50 and P90, EUR, PDP and PUD, NPV10, price decks, rigs and frac crews. That comes from 3.5 years designing inside ComboCurve’s product team. We still learn your product’s specifics from your engineers in the first weeks, because every company forecasts, books reserves and schedules a little differently.
How much does oil and gas software design cost?
Product or website projects start at $12k (6–10 weeks), design partnerships at $6k a month and Conversion Sprints at $8k. See pricing for what is included and what changes a quote.
Can you join our product team the way you did at ComboCurve?
Yes. As a design partner, senior DIXI designers join your rituals and tools: standups, planning, your design files and tracker, and reviews with engineers before and after each build. At ComboCurve that model ran for 3.5 years across forecasting, economics, scheduling, the map and the design system. Partnerships start at three months and then run month to month.
Do you only design, or do you also build?
For websites, we design and build in Webflow, Framer, Astro or custom code, on a CMS your marketing team can edit. For complex platforms like forecasting or economics tools, we usually design alongside your engineers and deliver components, specs and every state, as we did at ComboCurve. For smaller products and internal tools we can build the front-end too.
Can you redesign a desktop engineering tool for the browser?
Yes, and the hardest part isn’t the visuals. Desktop tools built decades ago carry habits engineers depend on: dense grids, keyboard speed, familiar case structures and exports to Excel. We map those habits first, keep what makes experts fast, and redesign around shared data, collaboration and bulk work, so the new tool feels familiar on day one and faster soon after.
Why does UX matter so much in oil and gas software?
Because adoption decides whether the software pays off. Engineers who have used desktop tools for decades will work around a platform that slows them down. Researchers at TGS argue that poor UX in energy software leads to inefficiencies, safety hazards and missed opportunities (EAGE, 2025). Good UX shortens the learning curve and lets engineers review thousands of wells instead of one at a time.
Do you design websites for energy software companies?
Yes. We write and design sites that explain a technical platform to engineers, executives and IT at once: role and use-case pages, the product shown in motion, clear security and integration answers, and customer proof above the fold. Our B2B websites have delivered 3.2× qualified leads for Klik Solutions and 18% more demo bookings for an AI outbound platform.
Do you work outside upstream oil and gas?
Our deepest proof is upstream: forecasting, type curves, economics, scheduling and maps for ComboCurve. The same patterns, such as dense tables, expert users, scenario comparison and audit trails, carry over to minerals and royalties, A&D, midstream planning and emissions tools. We also design fintech and enterprise SaaS, such as Koyfin and HCM International.
Designing softwarefor engineers? Let’s talk.
Book a 25-minute call with Ignat, or start with a free teardown of your homepage.
We use essential storage to run this site. With your OK we also use analytics to see which pages help visitors. No ad tracking. Cookie policy
Cookie settings
Choose what we can use. You can change this any time from Cookie settings in the footer.
- Strictly necessaryKeeps the site secure and working, and remembers your cookie choice.Always on
- AnalyticsAnonymous usage stats and heatmaps (Microsoft Clarity) that show which pages help visitors.
- MarketingCompany-level visit insights from Apollo.io, so we can see which businesses look at our work.