Energy software UX design agencyFrom wellsto grids.
Product UX, design systems and websites for software engineers trust with million-dollar decisions: power and grid, renewables and storage, geothermal and CCS, and upstream oil and gas. Built on 3.5 years inside ComboCurve’s product team.
 By Ignat, founder of DIXI · Updated
- FeasibilityFeb 2025
- System impactSep 2025
- FacilitiesDue Jan 2027
- IA signedTarget Apr 2027



What does an energy software design agency do?
An energy software design agency designs the tools engineers and operators use to plan, forecast and run energy assets. DIXI does this for upstream oil and gas, power and grid, renewables and storage, and geothermal and CCS software, drawing on 3.5 years inside ComboCurve’s product team, a platform 400+ energy companies use. Projects start at $12k; a Conversion Sprint at $8k.
- StudioDIXI, founder-led product and web design
- Founded2016
- BasedDnipro, Ukraine
- Energy work3.5 years inside ComboCurve’s product team
- SegmentsUpstream, power and grid, renewables and storage, subsurface
- FormatsProjects from $12k · partner from $6k a month
Which energy software do we design?
Software where engineering data turns into a capital or operating decision. We design across five segments: upstream oil and gas, where our proof is deepest; power, grid and utilities; renewables and storage; the subsurface transition, from geothermal to CCS and lithium brine; and industrial telemetry. The screens differ, but the hard parts repeat: scale, uncertainty, maps, schedules and money.
- Deepest proof
Upstream oil and gas
Forecasting and decline curves, type curves, economics, reserves and development scheduling for operators, mineral buyers and A&D teams.
- Reservoir engineers
- A&D teams
- Reserves
- Patterns carry over
Power, grid and utilities
Interconnection queues, capacity and transmission planning, outage and asset maps, and the field tools crews use to keep lines up.
- Planning engineers
- Grid operators
- Field crews
- Patterns carry over
Renewables and storage
Asset performance, P50 and P90 yield, dispatch and bidding, PPA and merchant economics, and portfolio views across hundreds of sites.
- Asset managers
- Traders
- Developers
- Patterns carry over
Subsurface transition
Geothermal well and reservoir planning, CO₂ injection and storage monitoring for CCS, and lithium brine resources: the workflows closest to upstream.
- Geoscientists
- Reservoir engineers
- Regulators
- Patterns carry over
Industrial and manufacturing telemetry
Sensor and SCADA data turned into exception lists, trends and work orders for plants, pipelines and facilities.
- Operators
- Reliability engineers
- Plant managers
- Not listed?
Another kind of engineering data
Mining, water, carbon accounting or another data-heavy tool: if engineers make expensive decisions in it, the same principles apply.
Book a 25-min call →
“Deepest proof” means shipped work: 3.5 years of features inside ComboCurve. “Patterns carry over” means segments where the same interface problems appear; we have not published a case in them yet.
What did 3.5 years inside ComboCurve teach us about energy data UX?
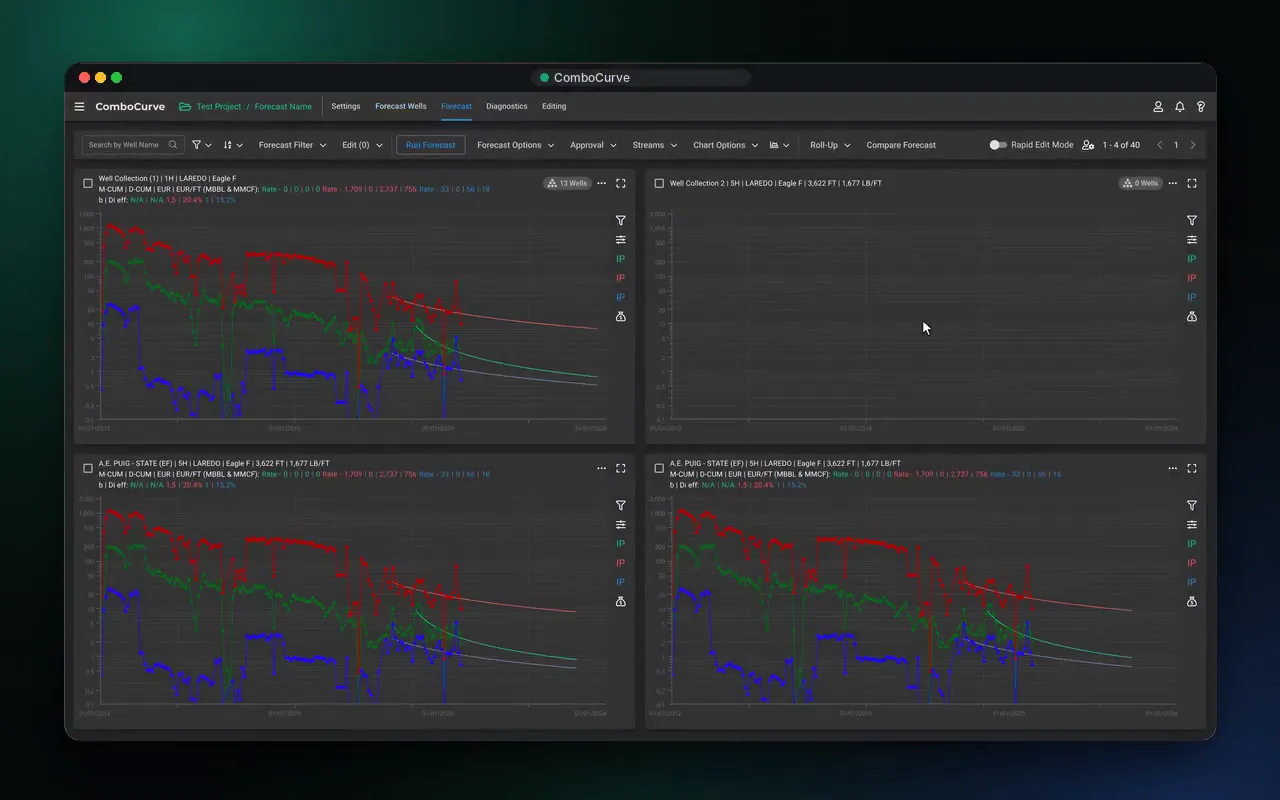
That scale, not styling, decides the design. ComboCurve auto-forecasts up to 25,000 wells in minutes and runs economics on up to 75,000 at once, so every table, chart and selection had to stay usable at that count. Engineers trusted a number only when its inputs were one click away. And time and space kept turning out to be one problem: the schedule and the map.
Design for the whole portfolio
Engineers select hundreds of assets, act in bulk and open one only when something looks wrong. Review queues and bulk edits come before single-asset screens.
Every output traces to an input
A forecast or an NPV gets argued over in meetings. Price decks, costs and fit parameters sit one click from every result, with change history behind them.
Time and space are one workflow
The Scheduler’s Gantt and the layered map answer the same question: what happens where, and when. Selections stay in sync between them.
One grammar across modules
Units, number formats, one data table and one chart style in the design system, so forecasting, economics and scheduling read as one product.

“Over 3 years of collaboration, Ignat played an important role in scaling the product and website while the company grew by 650%. He built our design system and improved key workflows for a platform trusted by 170+ companies.”
Isabel Ramos · UX Architect, ComboCurve
How does oil and gas UX transfer to geothermal, CCS and grid software?
Directly, because the engineering problems repeat. A geothermal well is forecast like an oil well. A PPA is a price-deck scenario under another name. An interconnection timeline is a schedule with dependencies, and a substation map is a basin map with different layers. We bring the patterns that worked at scale, then learn your physics, units and regulations from your engineers.
| What we designed at ComboCurve | The problem it solves | Where it reappears in power, renewables and subsurface | What carries over |
|---|---|---|---|
| Forecasting and decline curves | Predict output from noisy history across thousands of assets | Geothermal well and reservoir output; solar and wind generation forecasts; battery degradation | Bulk review queues; history and forecast on one chart; fit parameters beside it |
| Type curves, P10/P50/P90 | Uncertainty ranges built from analog wells | P50 and P90 energy yield; geothermal resource cases | Percentile overlays; cases named the way engineers name them |
| Economics and scenarios | NPV across price decks, costs and ownership | PPA pricing, merchant versus contracted revenue, dispatch value, LCOE | Scenarios side by side; drill-down to the asset; inputs one click from every result |
| Scheduler: Gantt and resources | Rigs and crews across pads and years | Interconnection milestones, EPC and field crews, outage and maintenance windows | A readable Gantt with utilization and conflicts flagged |
| Map with layers | Basins, sections and offset wells | Assets, substations, feeders, transmission lines, lease and permit areas | Layers coloured by any attribute; lasso selection synced with the table |
| Design system | Many modules, many teams shipping at once | The same problem in every multi-module energy platform | Units and number formats, one table, one chart grammar |
Left column: features we designed inside ComboCurve’s modules. Right columns: where the same patterns apply. We have not shipped a grid, storage or geothermal product yet, so a first project starts with a short domain sprint with your engineers.
How do you design energy data people can trust?
By showing where every number comes from and how sure it is. Each value carries its method and source; forecasts show ranges and scenarios instead of false precision; physical units sit next to their money value; and screens lead with what changed, not with everything. In the field, tools keep working on a weak connection and sync when the signal returns.
Method and source beside the number
Metered, estimated or modeled? Which dataset, which date? One hover answers it without leaving the screen.
Ranges before point estimates
P50 and P90, scenarios side by side and confidence shown as a band, so a forecast is never read as a promise.
Units, then money
MWh next to dollars, kW next to $/kW. Engineers check the physics, finance reads the value, both on one row.
Exceptions first
Alerts on what moved since the last review: an underperforming inverter, a well off its type curve, a study that slipped.
Freshness on the label
Real-time, hourly or month-end: every chart says how fresh its data is, and stale data looks stale.
Built for the field
Large targets, offline drafts and sync on reconnect for crews working at sites with one bar of signal.
Who uses energy software, and how do you design for each role?
Most energy platforms serve five or more roles from one dataset. Operators need exceptions now; engineers need depth and control; asset and commercial managers need portfolio value; reporting leads need auditable numbers; lenders, auditors and regulators need to see how results were produced. We design role-based home screens on one shared data model, so each role sees its own questions first.
| Role | The decision they make | What we design for them |
|---|---|---|
| Operators and control-room staff | What needs attention right now | Exception lists ranked by impact; one-click drill-down to the asset |
| Engineers and analysts | Forecasts, studies and designs | Bulk tools, editable assumptions, scenario comparison, exports to Excel and Python |
| Asset and commercial managers | Where value is gained or lost | Portfolio views, dollars next to MWh, variance against budget and P50 |
| Sustainability and reporting leads | What goes into the report | Production and emissions figures with method, source and audit trail |
| Lenders, auditors and regulators | Whether the numbers hold up | Read-only views, versioned reports and the inputs behind every figure |
Where is energy software money going in 2026?
Toward firm power and the data behind it. Climate tech venture funding reached $26.1B in the first half of 2026, up 55% year over year, while carbon-focused startups fell 61% and low-carbon data centers took 34% of the total. In Q3, fusion, fission, geothermal and storage companies raised about $6.3B of $19.6B. Each of those bets needs planning, monitoring and finance software.
That is why this page talks about energy and engineering data rather than climate: the growth is in software that plans, connects and finances firm power, and the people using it are engineers.
Figures as reported on 22 July and 19 October 2026; checked 31 October 2026.
What does an energy software UX project cost and how long does it take?
With DIXI, a Conversion Sprint starts at $8k (3–4 weeks), a product or website project at $12k (6–10 weeks) and a design partnership at $6k a month. For comparison, a cleantech design agency lists 6–12 week engagements with budget options from $10k–20k to $100k–200k, and mid-market energy website redesigns run about $15k–80k.
| Option | Price | Timeline | What you get | Source |
|---|---|---|---|---|
| DIXI Conversion Sprint | From $8k | 3–4 weeks | Audit and redesign of your highest-traffic page; build and launch as an optional add-on | DIXI |
| DIXI project | From $12k | 6–10 weeks | Workflows, UI, design system, specs and every state; or a website designed and built | DIXI |
| DIXI design partner | From $6k a month | 3 months minimum, then month to month | Senior designers inside your product team | DIXI |
| Cleantech UX agency | Budget options from $10k–20k to $100k–200k on its enquiry form | 6–12 weeks | Data mapping through to engineering handoff | Halo Lab |
| Energy website agency | Mid-market redesign about $15k–80k | 10–16 weeks for a focused redesign | Marketing site, CMS, investor and ESG sections | RaftLabs |
| Design agency with an energy page | Not published | Not published | UX research, prototypes, design systems | Onething |
Third-party prices and timelines as published on each source, checked 31 October 2026. All DIXI formats: see pricing.
How does an engagement work?
Most energy teams start with a scoped project or a Conversion Sprint, then keep us on as a design partner. Week one is working sessions with your engineers and operators. We map the workflow and the data, design with real-scale sample data and review every build with your developers. Calls run in Houston and Denver mornings, and across a full working day with Europe.
- 01
Learn the engineering
Working sessions with your engineers, operators and analysts: how they plan, forecast and report, in their words and units.
- 02
Audit the data and the workflow
Sources, units, refresh rates and edge cases, plus the path from raw data to a decision, so screens follow the work.
- 03
Design at real scale
Thousands of assets, missing values, long names, mixed units and scenarios side by side, tested with the people who use them.
- 04
Ship with your engineers
Components, specs and every state, reviewed during the build; or we build the front end and the website ourselves.
- HoustonReviews in your morning, our afternoon
- DenverReviews in your morning, our afternoon
- EuropeA full shared working day
How can we work together?
A project designs a defined scope, such as a planning module or a new website. A design partner joins your product team, the way we worked with ComboCurve. A Conversion Sprint fixes the page that sells your platform.
Audit and redesign of your homepage or key page: message, structure, proof.
- Audit of message, structure and proof
- Redesign of your homepage or key page
- Not included: Full website or product design
- Optional: Build and launch, as an add-on
- Not included: Design system your team can grow
- Not included: Experiments and monthly reviews
Full website or product redesign, with a design system your team can grow.
- Audit of message, structure and proof
- Redesign of your homepage or key page
- Full website or product design
- Development and launch
- Design system your team can grow
- Not included: Experiments and monthly reviews
Ongoing product and web design, experiments and monthly reviews.
- Audit of message, structure and proof
- Redesign of your homepage or key page
- Full website or product design
- Development and launch
- Design system your team can grow
- Experiments and monthly reviews
Need something custom?
A bigger scope, several services at once or a different timeline. We will shape the format and the price around your project.
In-house designer, dev shop or design studio: which fits an energy software team?
Pick by where the hard part is. An in-house hire suits steady, long-term product work once you can recruit and manage one. An engineering firm with an energy page fits when the build is the bottleneck. A product design studio fits when the workflow itself is the problem: dense data, expert users and expensive decisions. Many teams pair a studio with their own engineers.
| Option | How you start | Energy domain depth | Design and build | Best for |
|---|---|---|---|---|
| DIXI, founder-led studio | A 25-minute call, then a fixed-scope proposal | 3.5 years inside ComboCurve; patterns from grid to subsurface | Design, design systems, websites and front end | Teams with a complex workflow and no senior designer to own it |
| In-house senior product designer | A hiring process | Grows with time in the role | Design; your engineers build | Long-term product work once the team can manage a designer |
| Engineering firm with an energy page | A discovery phase and statement of work | Varies; design work is rarely shown | Build first, design second | Teams whose bottleneck is engineering capacity |
| Freelance UX designer | A contract for a defined scope | Varies by person | One discipline at a time | Small, well-defined screens |
Is DIXI the right partner for your energy software?
We fit energy software companies from Seed to Series C, and digital teams inside energy companies, whose users are engineers and analysts making expensive decisions. We are not the right partner for real-time control-room screens, hourly staff augmentation or projects under $8k.
A good fit
- Energy software companies from Seed to Series C: grid, storage, renewables, subsurface or upstream
- Product and digital teams at utilities, IPPs and operators replacing spreadsheets and desktop tools
- Users who are engineers, analysts or operators making capital or operating decisions
- Budgets from $8k for a Sprint, $12k for a project or $6k a month for a partnership
Not a fit
- Real-time SCADA and control-room screens governed by HMI standards such as ISA-101; we design the planning and analytics layer around them
- Hourly staff augmentation without ownership of the outcome
- Consumer marketing for energy retailers
- Projects under $8k
Built with
Websites in Webflow, Framer, Astro and Shopify. Products in React, Next.js and React Native.
 Webflow
 Framer
 Astro
 Shopify
 React
 Next.js
 React Native
 Swift
 Figma
 Cloudflare

Work directly with the founder
I'm Ignat, and you work with me directly: no account managers and no handoffs, just a senior team that designs and builds your site.
 Ignat · Founder
Do you only design for oil and gas software?
No. Our deepest proof is upstream: 3.5 years of features inside ComboCurve. The same interface problems, such as bulk review, forecasts with uncertainty, scenario economics, schedules and maps, appear in grid, storage, renewables, geothermal and CCS software, and we design for those teams too. For upstream specifics, see our oil and gas software page.
Can you design for geothermal, CCS or grid software without a case in that exact segment?
Yes, and we say so plainly: we have not published a grid, storage or geothermal case yet. What transfers is the hard part, designing forecasts, scenarios, schedules and maps for engineers at scale. A first project starts with a short domain sprint with your engineers, and the concept screens on this page show how we would approach it.
How do you show uncertainty, scenarios and units in energy dashboards?
Ranges before point estimates: P50 and P90 lines with a band between them, scenarios side by side and the method behind each number one hover away. Physical units sit next to their dollar value, so engineers check the physics and finance reads the money on the same row. Every chart also says how fresh its data is.
Can you design map-heavy and scheduling interfaces?
Yes. At ComboCurve we designed features for the map, with laterals coloured by any attribute and lasso selection synced with the well table, and for the Scheduler, a Gantt of every well’s steps with rig and crew utilization. The same patterns serve asset maps, substations and feeders, interconnection milestones and maintenance windows.
How much does energy software UX design cost?
With DIXI, projects start at $12k, design partnerships at $6k a month and Conversion Sprints at $8k. For comparison, a cleantech design agency lists budget options from $10k–20k to $100k–200k on its enquiry form. See pricing for what each format includes.
How long does a project take?
A Conversion Sprint takes 3–4 weeks and a product or website project 6–10 weeks. Design partnerships start at three months and then run month to month; ours with ComboCurve ran for 3.5 years.
Do you also build the front end, or hand off to our engineers?
Both. For complex platforms we usually design alongside your engineers and hand over components, specs and every state, then review the build with them. For websites, smaller products and internal tools we can build the front end ourselves, in Webflow, Framer, Astro or React. You own all files and code.
Do you work with teams in Houston, Denver and Europe?
Yes. DIXI is based in Dnipro, Ukraine, and schedules calls to fit your time zone: our afternoon is the Houston and Denver morning, and we share a full working day with European teams. Clients include ComboCurve and Koyfin in the US and HCM International in Switzerland.
Building for energy?Let’s talk.
Book a 25-minute call with Ignat, or start with a free teardown of your energy software homepage.
We use essential storage to run this site. With your OK we also use analytics to see which pages help visitors. No ad tracking. Cookie policy
Cookie settings
Choose what we can use. You can change this any time from Cookie settings in the footer.
- Strictly necessaryKeeps the site secure and working, and remembers your cookie choice.Always on
- AnalyticsAnonymous usage stats and heatmaps (Microsoft Clarity) that show which pages help visitors.
- MarketingCompany-level visit insights from Apollo.io, so we can see which businesses look at our work.