


HCM International · Executive pay advisory
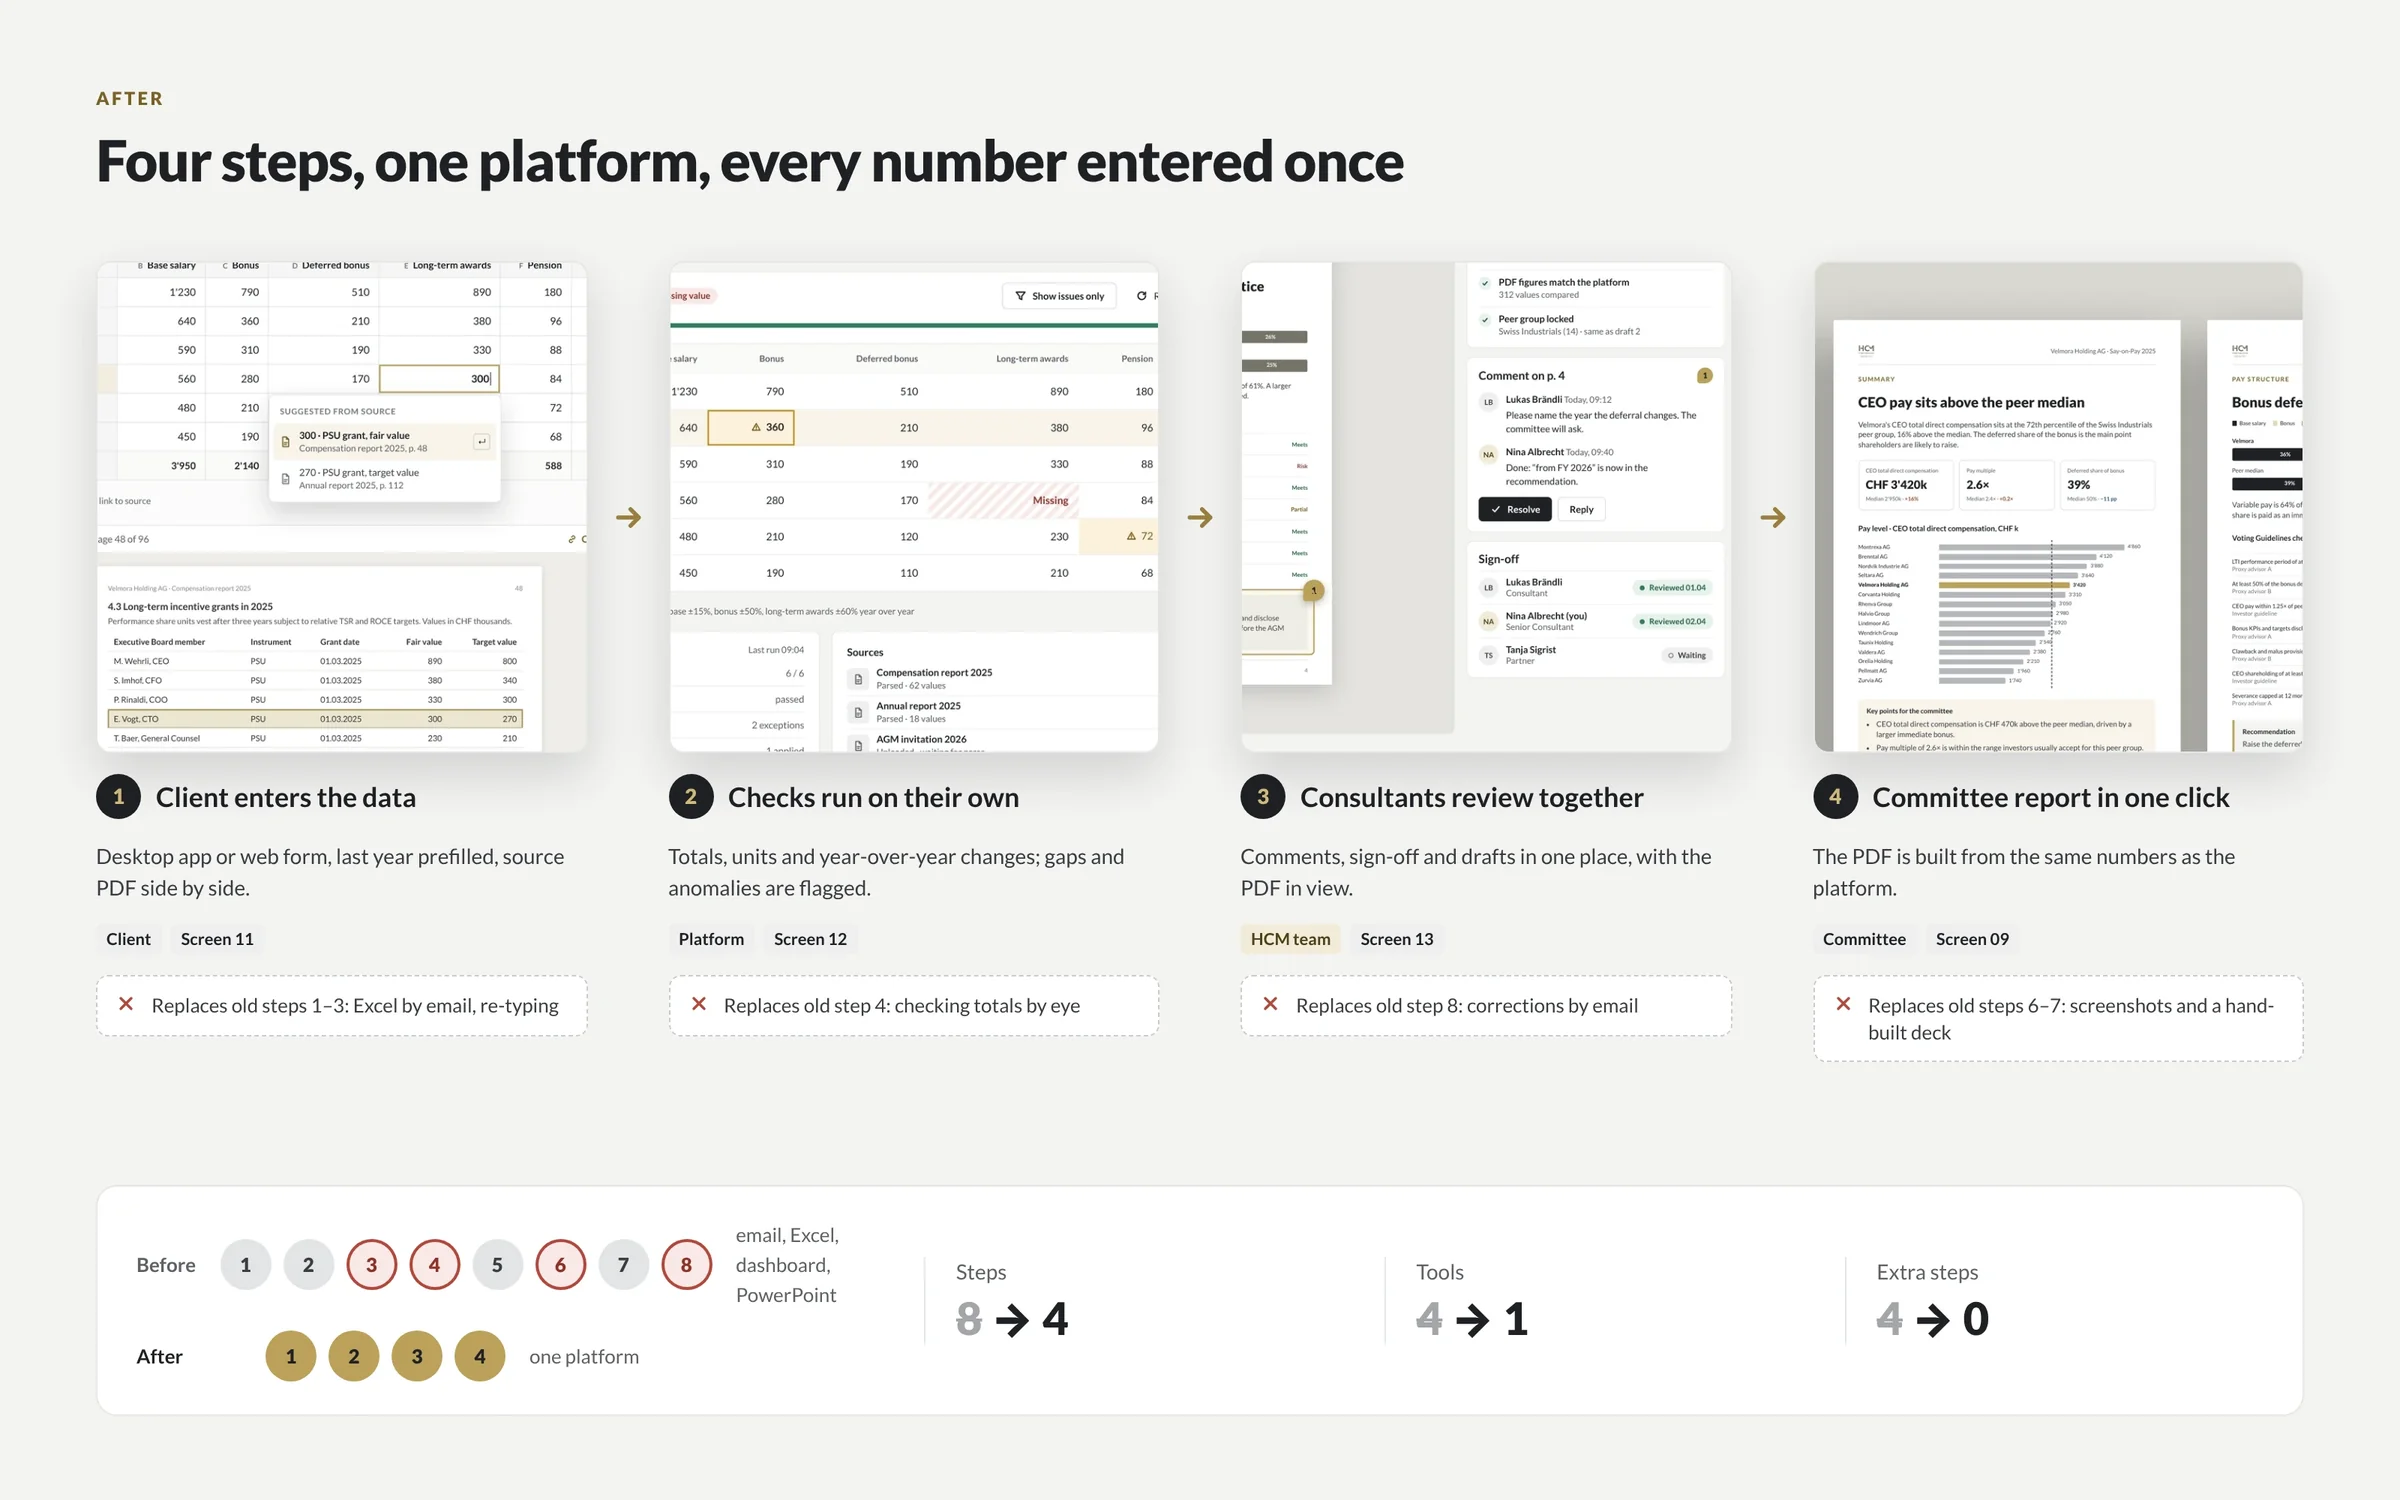
+22%more users reach a finished report. 8 steps across 4 tools became 4 steps in one platform, in 5–6 months.
Senior UX design and front-end for reporting platforms, analytics dashboards, internal data tools and legacy B2B software. We cut steps, raise completion and leave your engineers a design system they can build on, without a big-bang relaunch.
 By Ignat, founder of DIXI · Updated
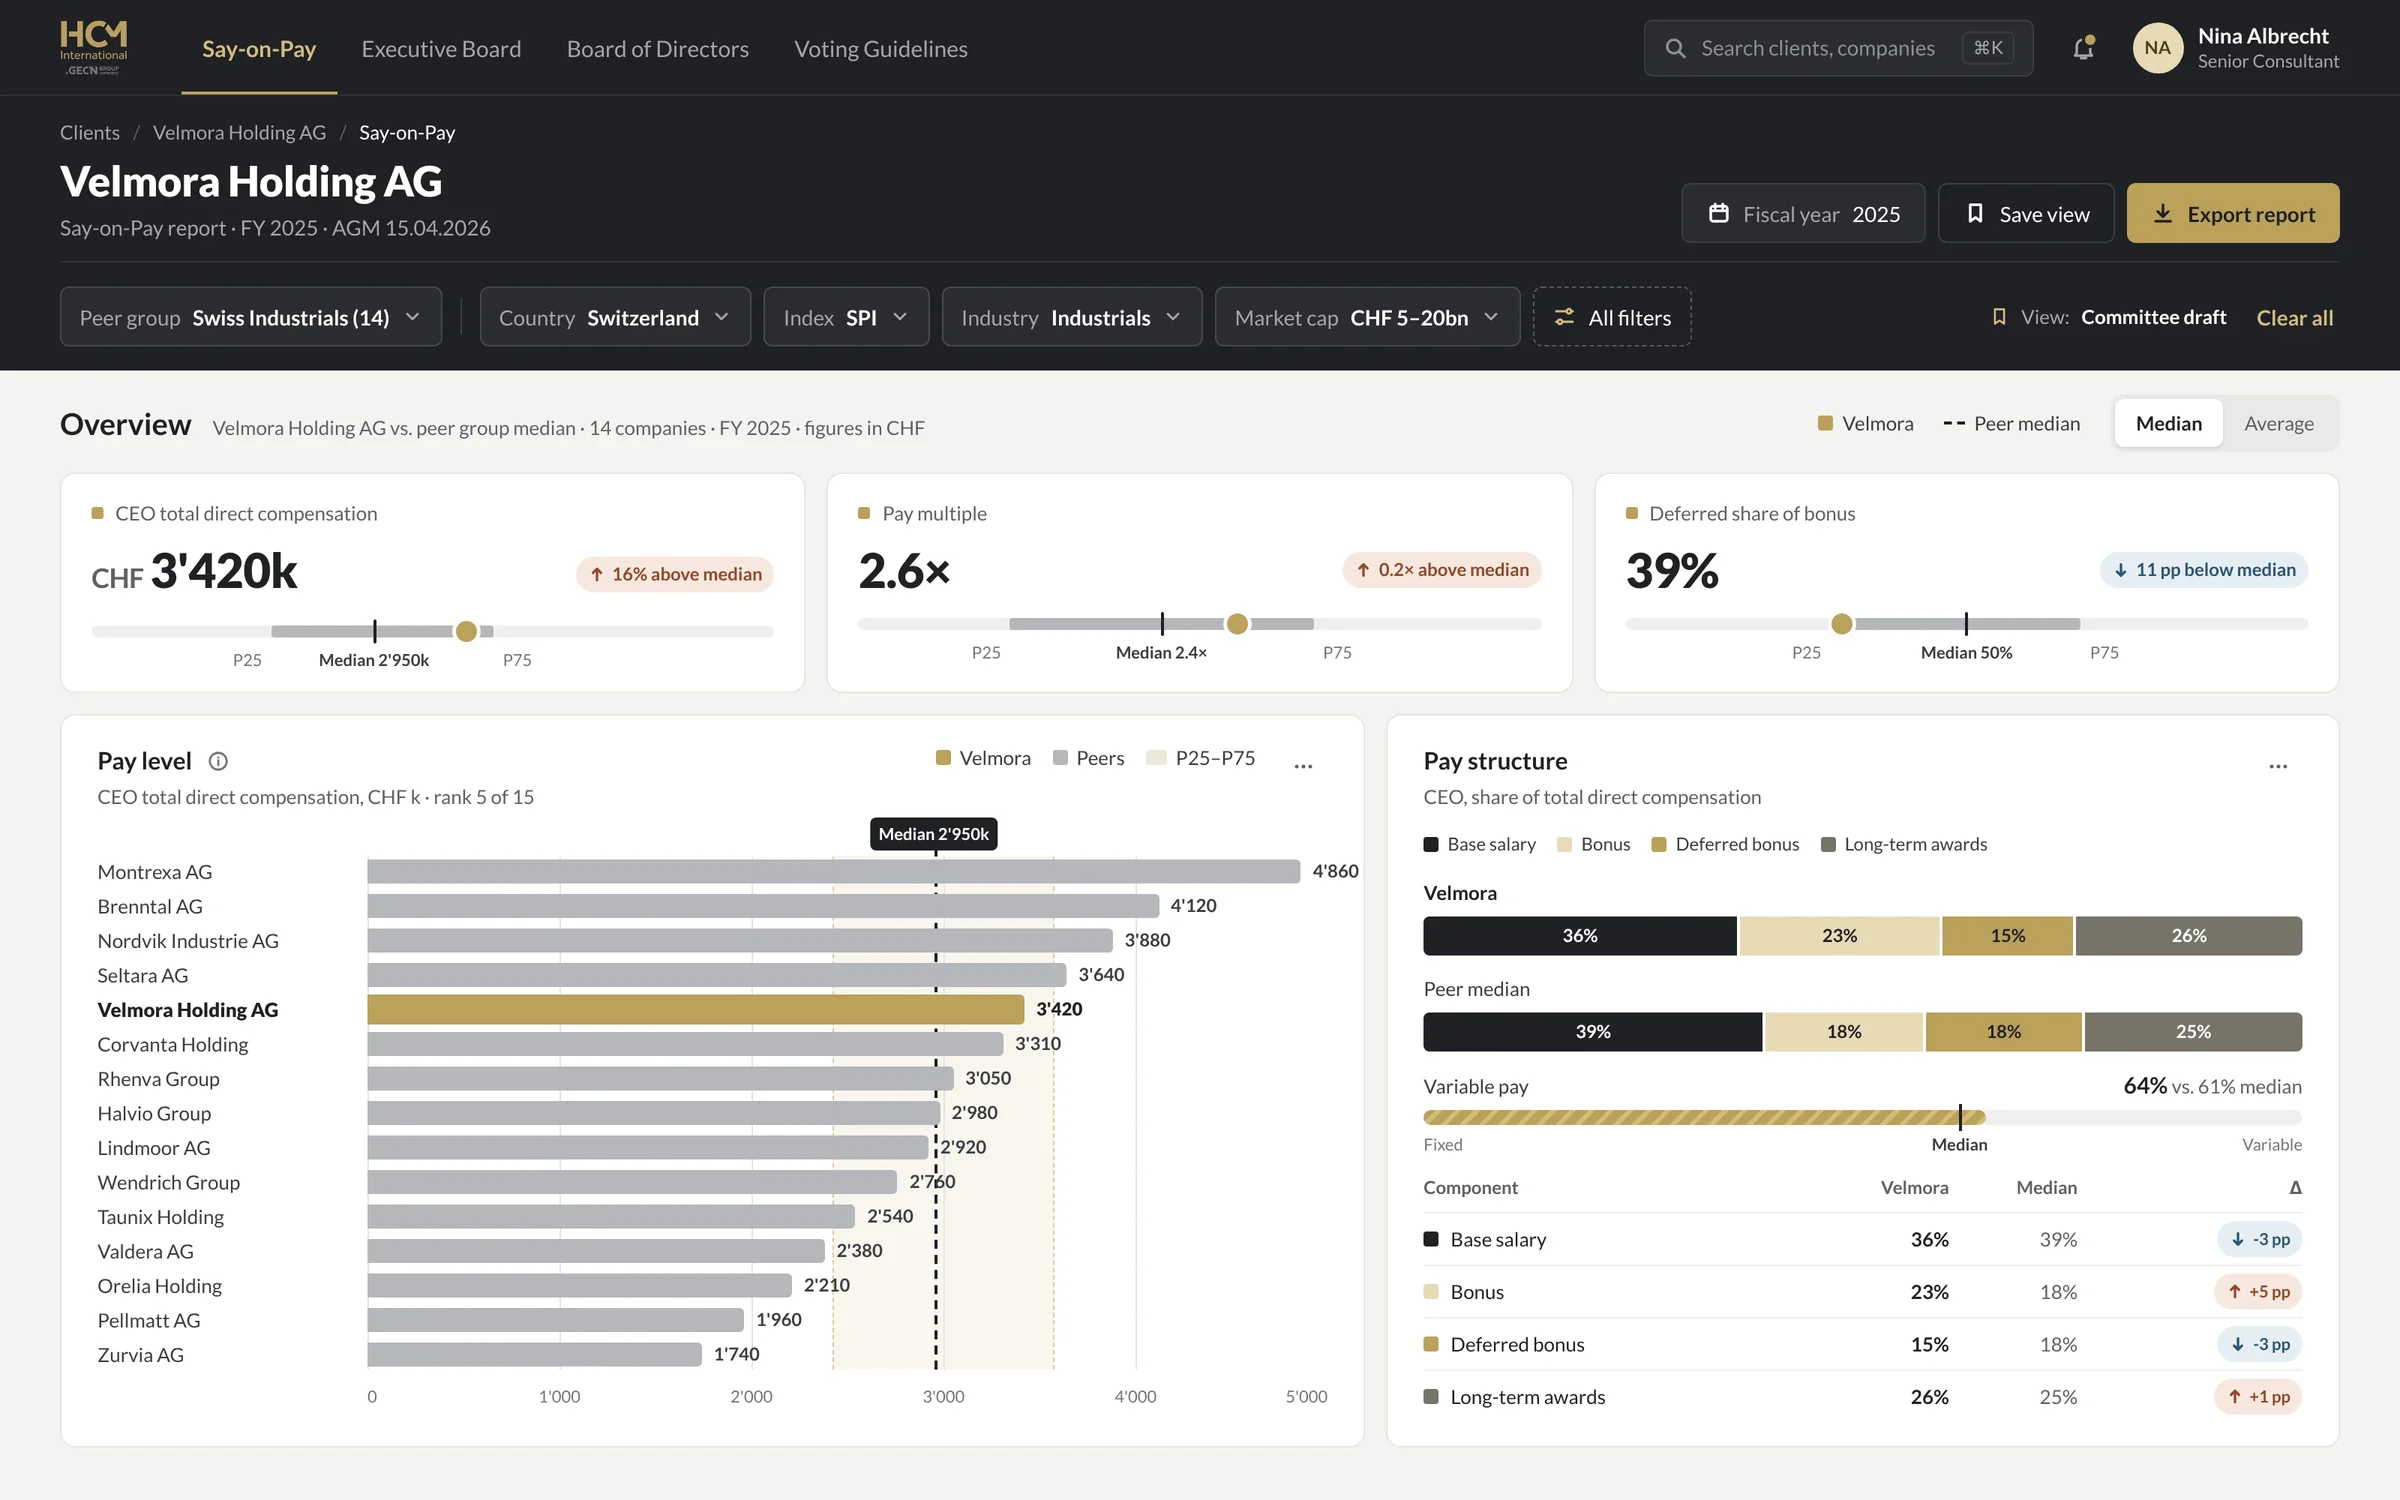
DIXI redesigns complex B2B software: reporting platforms, analytics dashboards, internal data apps and workflow SaaS. A senior design and front-end team cuts steps, raises completion and ships a design system your engineers can build on. HCM International went from 8 steps across 4 tools to 4 steps in one platform, with 22% more users reaching a finished report. Projects start at $12k.
Because every release adds a feature and almost none removes a step. Enterprise users can’t simply leave, so they build workarounds instead: exports to Excel, side spreadsheets, screenshots pasted into slides. The software still gets paid for, but less of it gets used, and the cost shows up as unused seats, longer training and more support tickets rather than as churn.
Each new feature lengthens an old workflow. HCM’s platform had grown so complex that only a small share of users finished the workflows that end in a report.
People use enterprise software because their job demands it. When it slows them down, they don’t churn. They route around it in Excel, email and slides.
Zylo’s 2026 SaaS Management Index puts the average organization’s spend on unused SaaS licenses at $19.8M a year. Vendor data.
In WalkMe’s 2025 survey of 3,700 executives and employees, workers lost an average of 36 working days a year to technology frustrations. Vendor data.
Sources: Zylo, 2026 SaaS Management Index · WalkMe, The State of Digital Adoption 2025 · HCM case. Checked 31 October 2026.
Six kinds of complex B2B software, all with expert users, dense data and expensive mistakes: reporting platforms, analytics dashboards, internal data and operations tools, workflow SaaS, engineering and scenario tools, and legacy enterprise interfaces. Most have outgrown their first design. We redesign the workflow first, then the screens, then the system that keeps every module consistent.
| Product type | Typical pain | What DIXI delivers | Where we’ve done it |
|---|---|---|---|
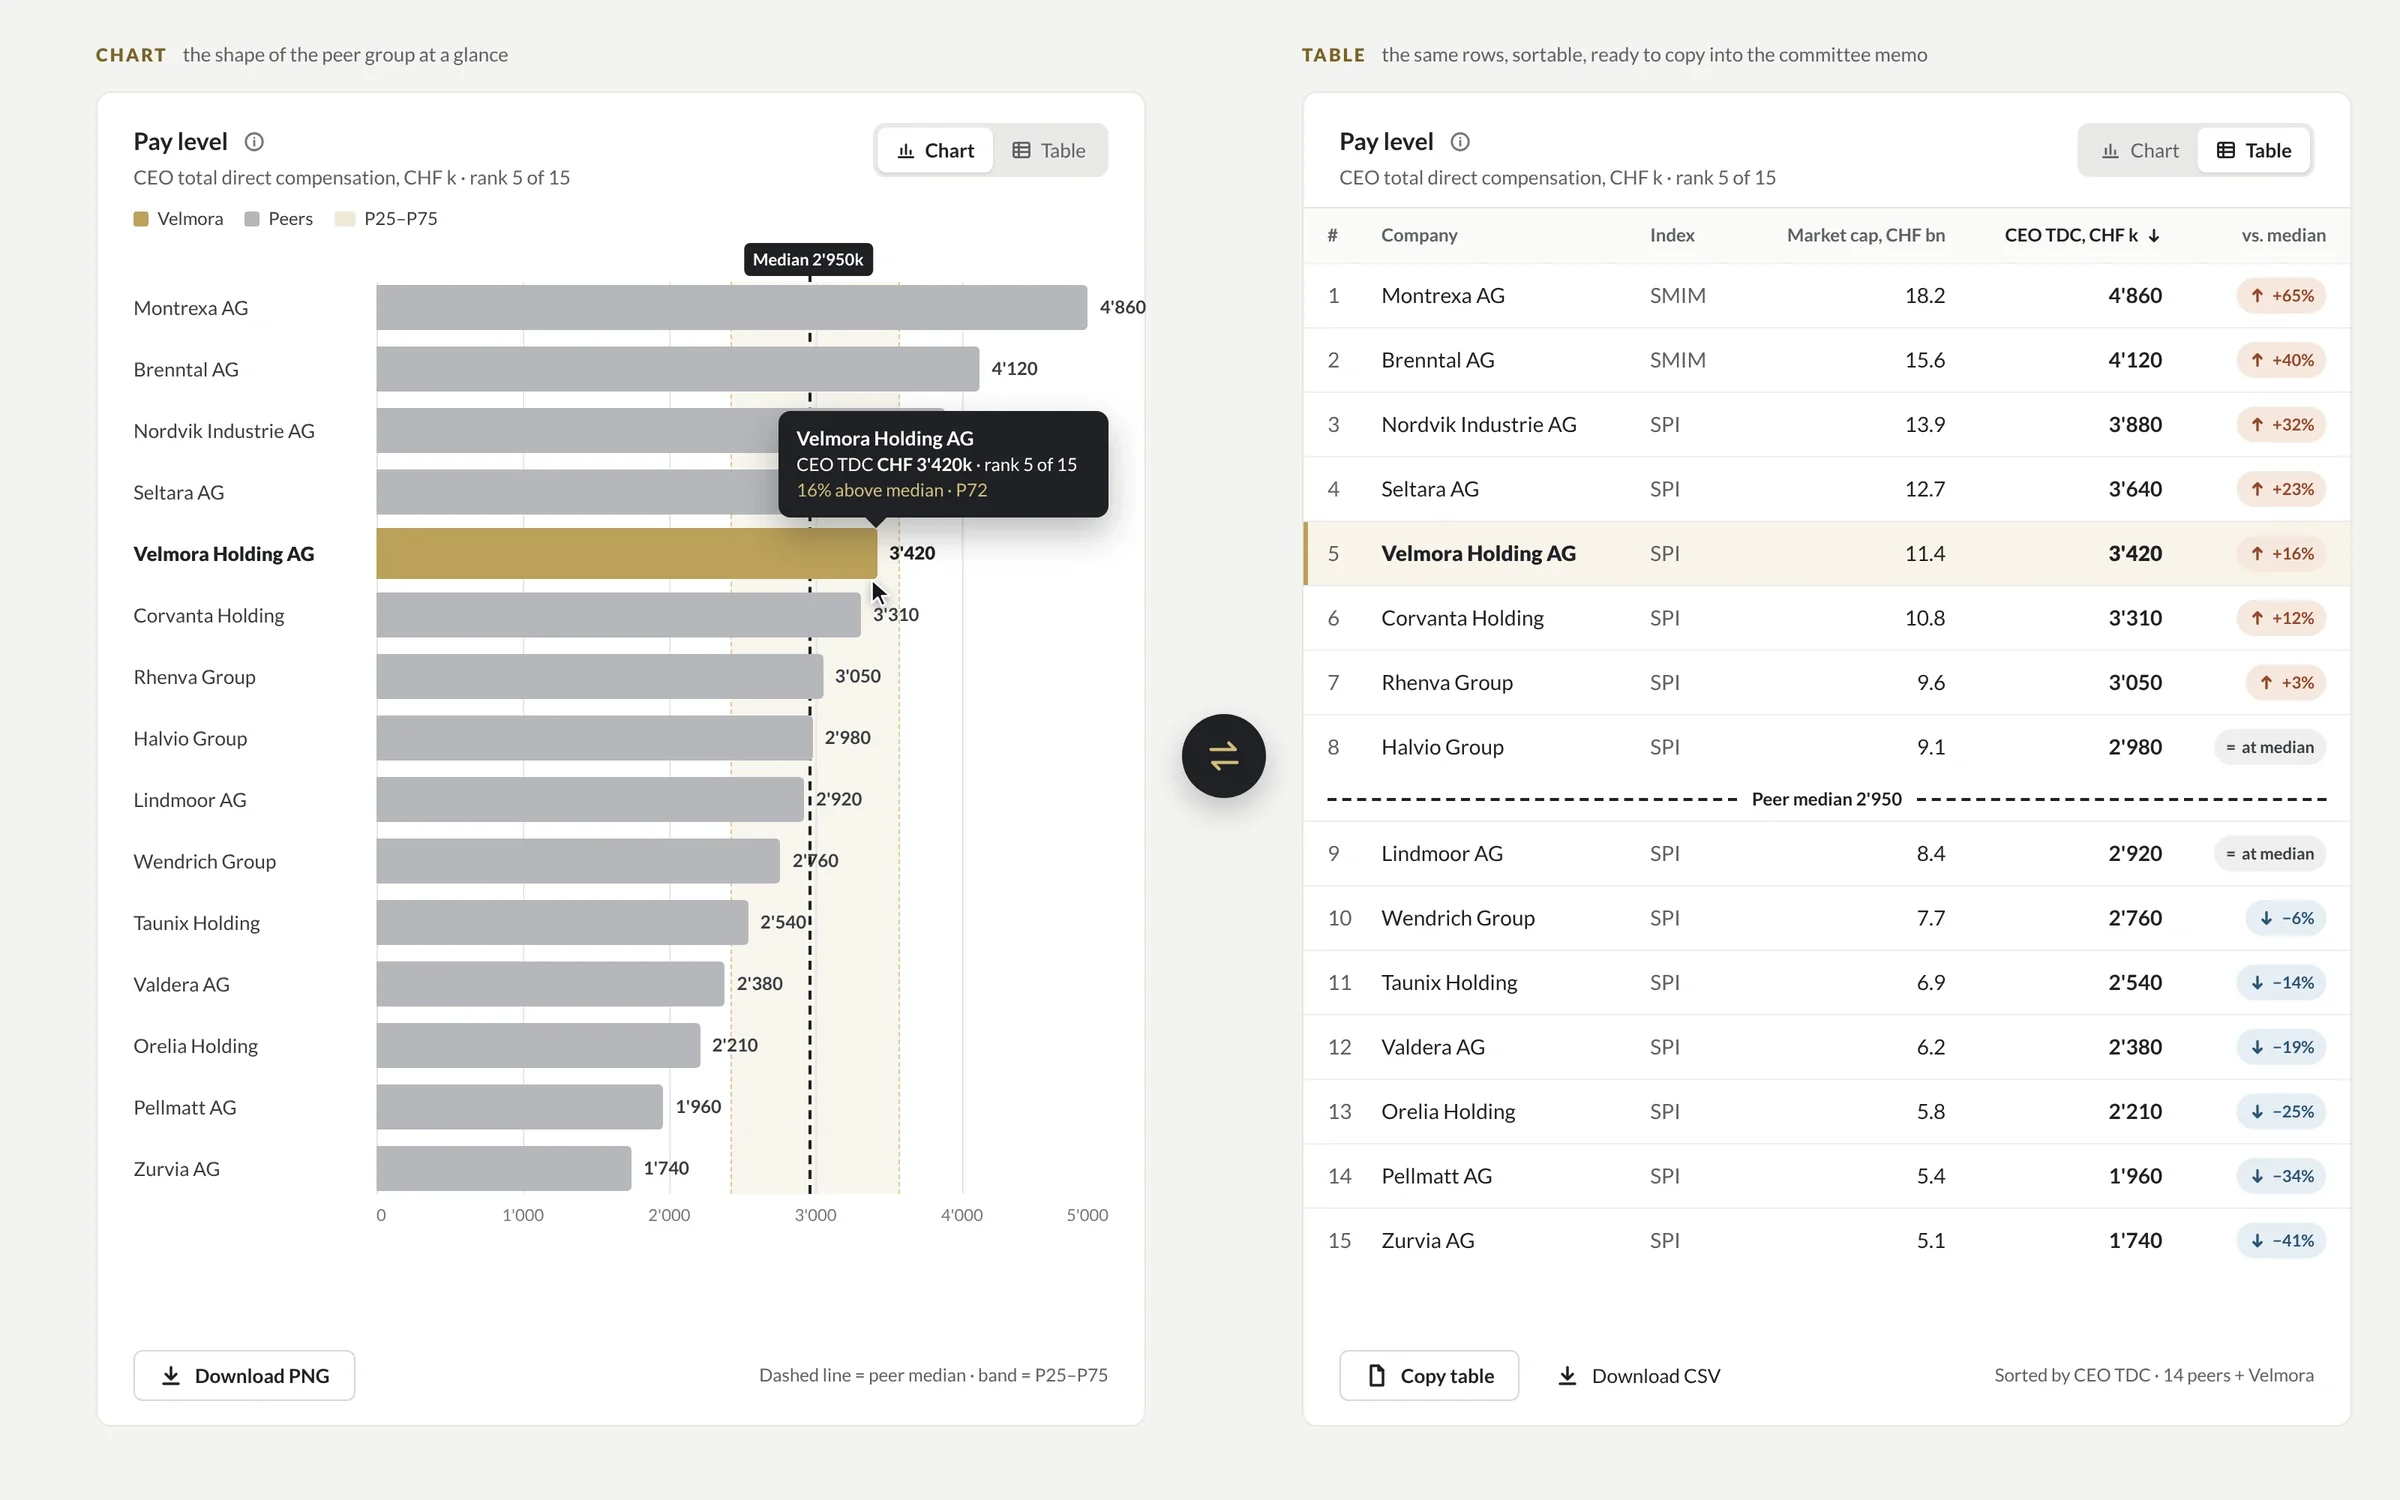
| Reporting platform | Few users reach a finished report; numbers re-entered across tools | One flow from data to export, saved views, a table behind every chart | HCM International |
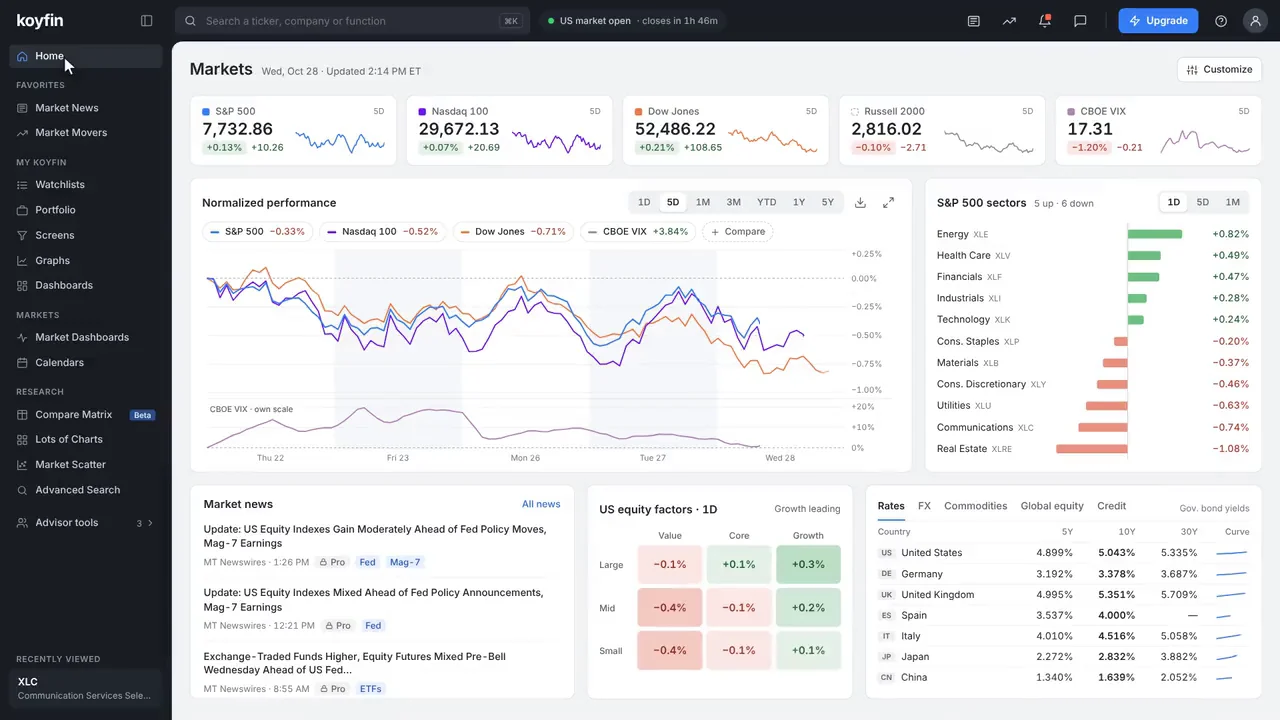
| Analytics dashboard | Many widgets, no answer; slow drill-down to the record | Answer-first layout, drill-down to the record, density modes, saved views | Koyfin, HCM International |
| Internal data or operations tool | Data collected in email and spreadsheets; no review trail | A workspace with status per record, data entry beside the source, review and sign-off | HCM internal app |
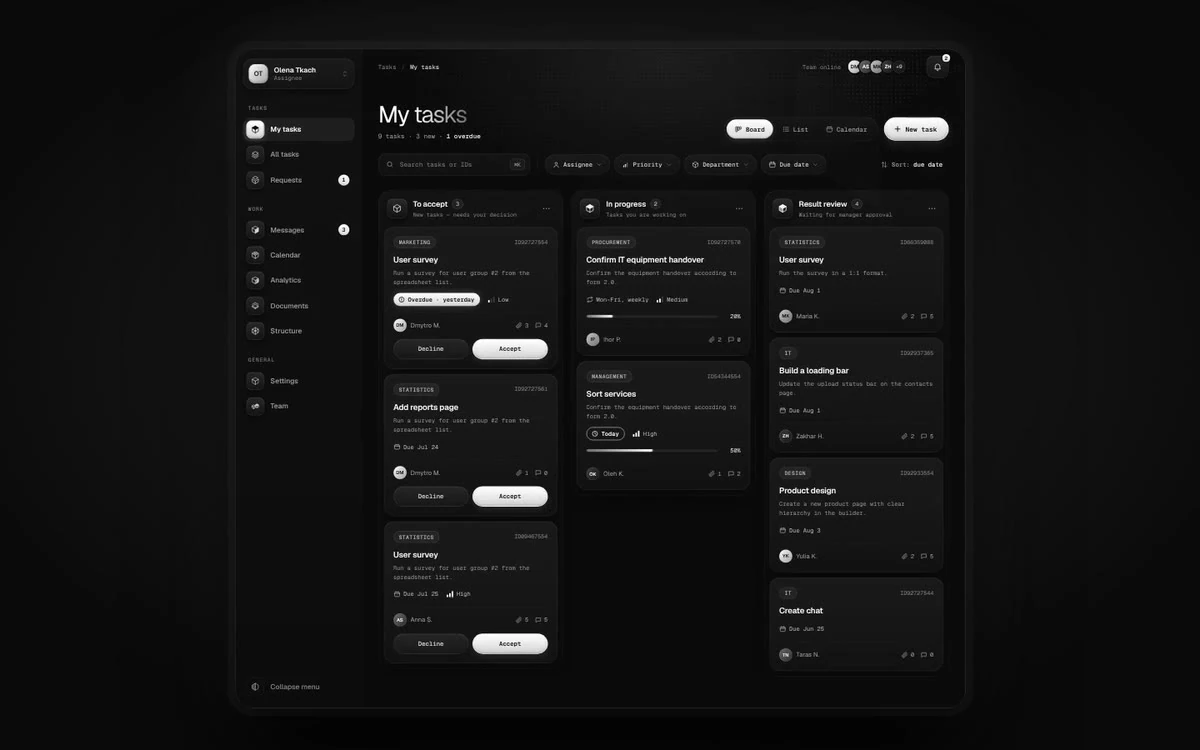
| Workflow SaaS | Work lost between teams; unclear ownership and status | A task and status model, role-based home screens, front-end designed and built | EW |
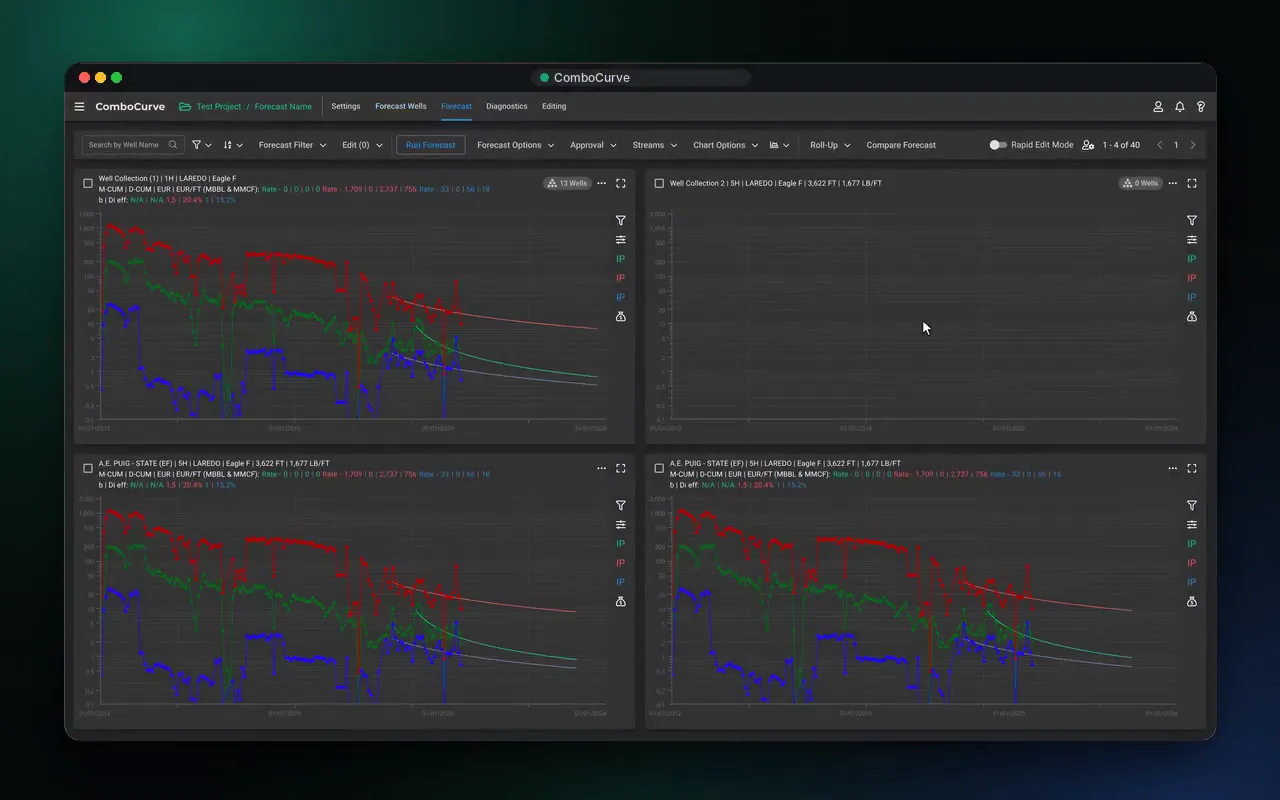
| Engineering and scenario tools | Thousands of records, many scenarios, desktop habits built over decades | Bulk-first tables, scenarios side by side, inputs one click from every result | ComboCurve |
| Legacy enterprise interface | Feature debt, undocumented rules, users wary of change | An audit of real paths, a design system, module-by-module rollout | HCM International, ComboCurve |
Four products, four kinds of complexity: a reporting platform rebuilt in 5–6 months, a workflow SaaS designed and built from zero, 3.5 years inside an energy platform and two years inside a fintech product team. Every number is named and linked to its source.
more users reach a finished report. 8 steps across 4 tools became 4 steps in one platform, in 5–6 months.
in the first 6 months. We designed and built the platform from scratch, front end included.
inside the product team, designing features for a platform that runs economics on up to 75,000 wells at once.
users during our 2020–2022 partnership: 8 core web features, a native mobile app from zero and the design system.
Client milestones are the work of each client’s whole team; design was one part. EW’s figure is client-reported.
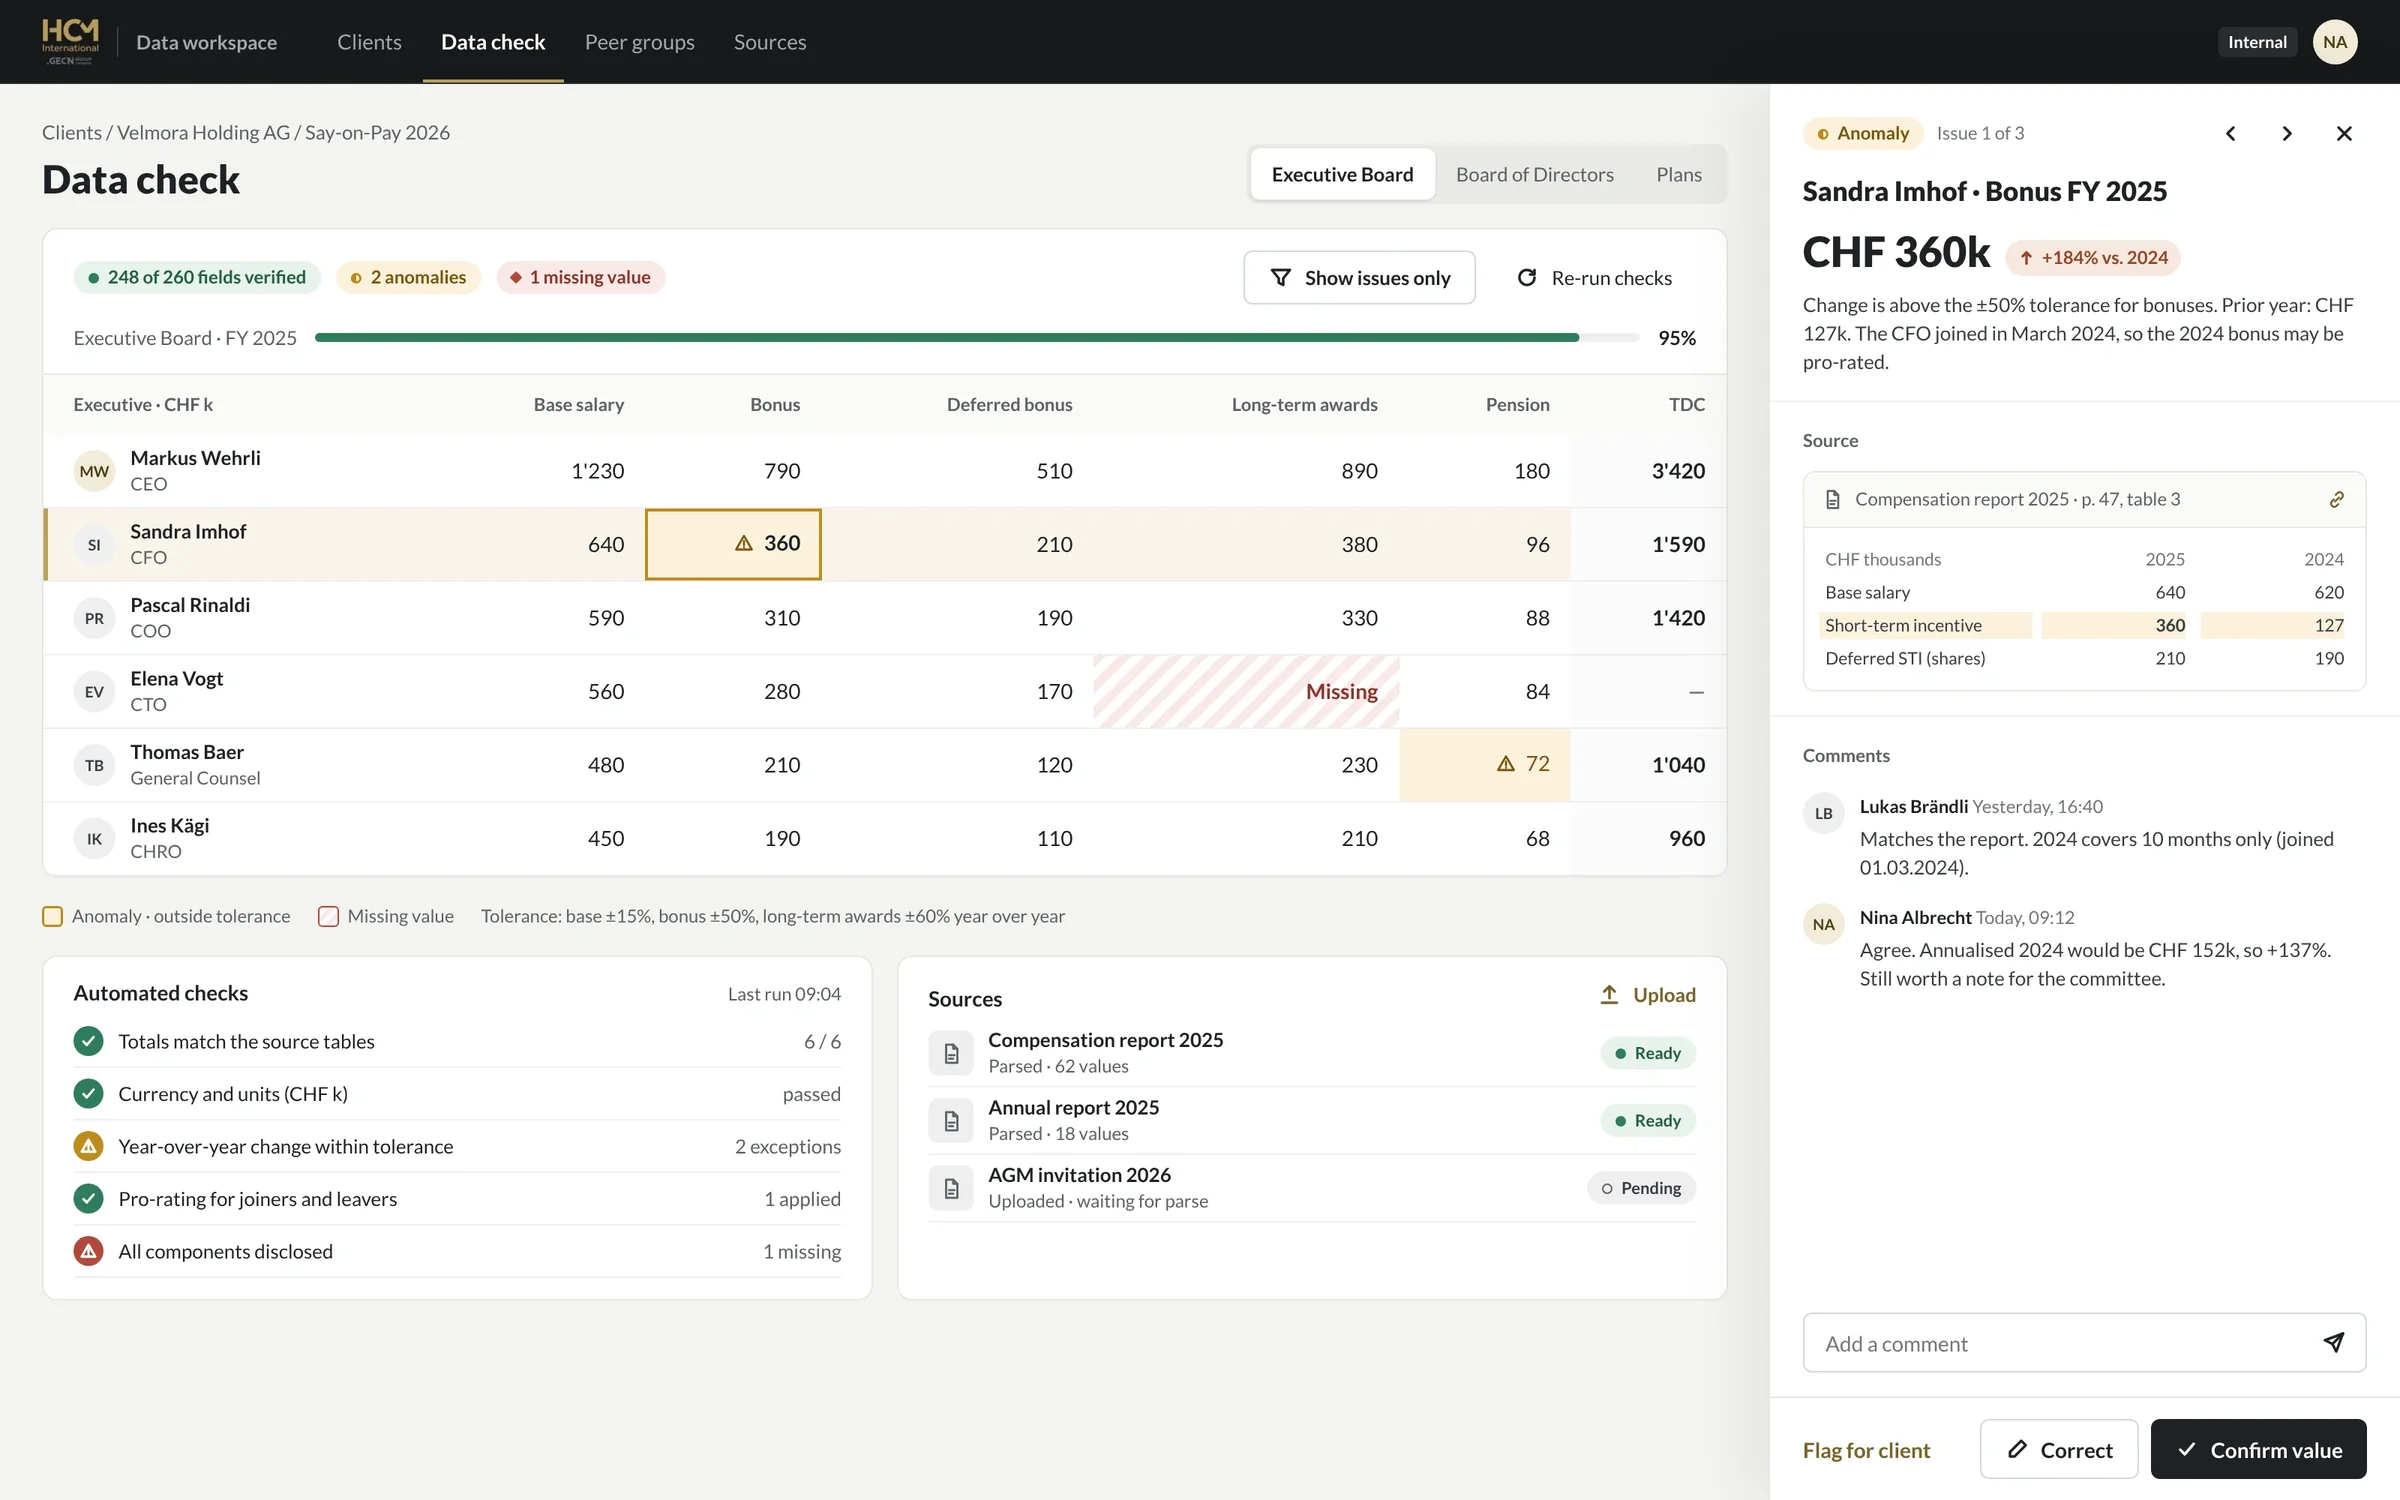
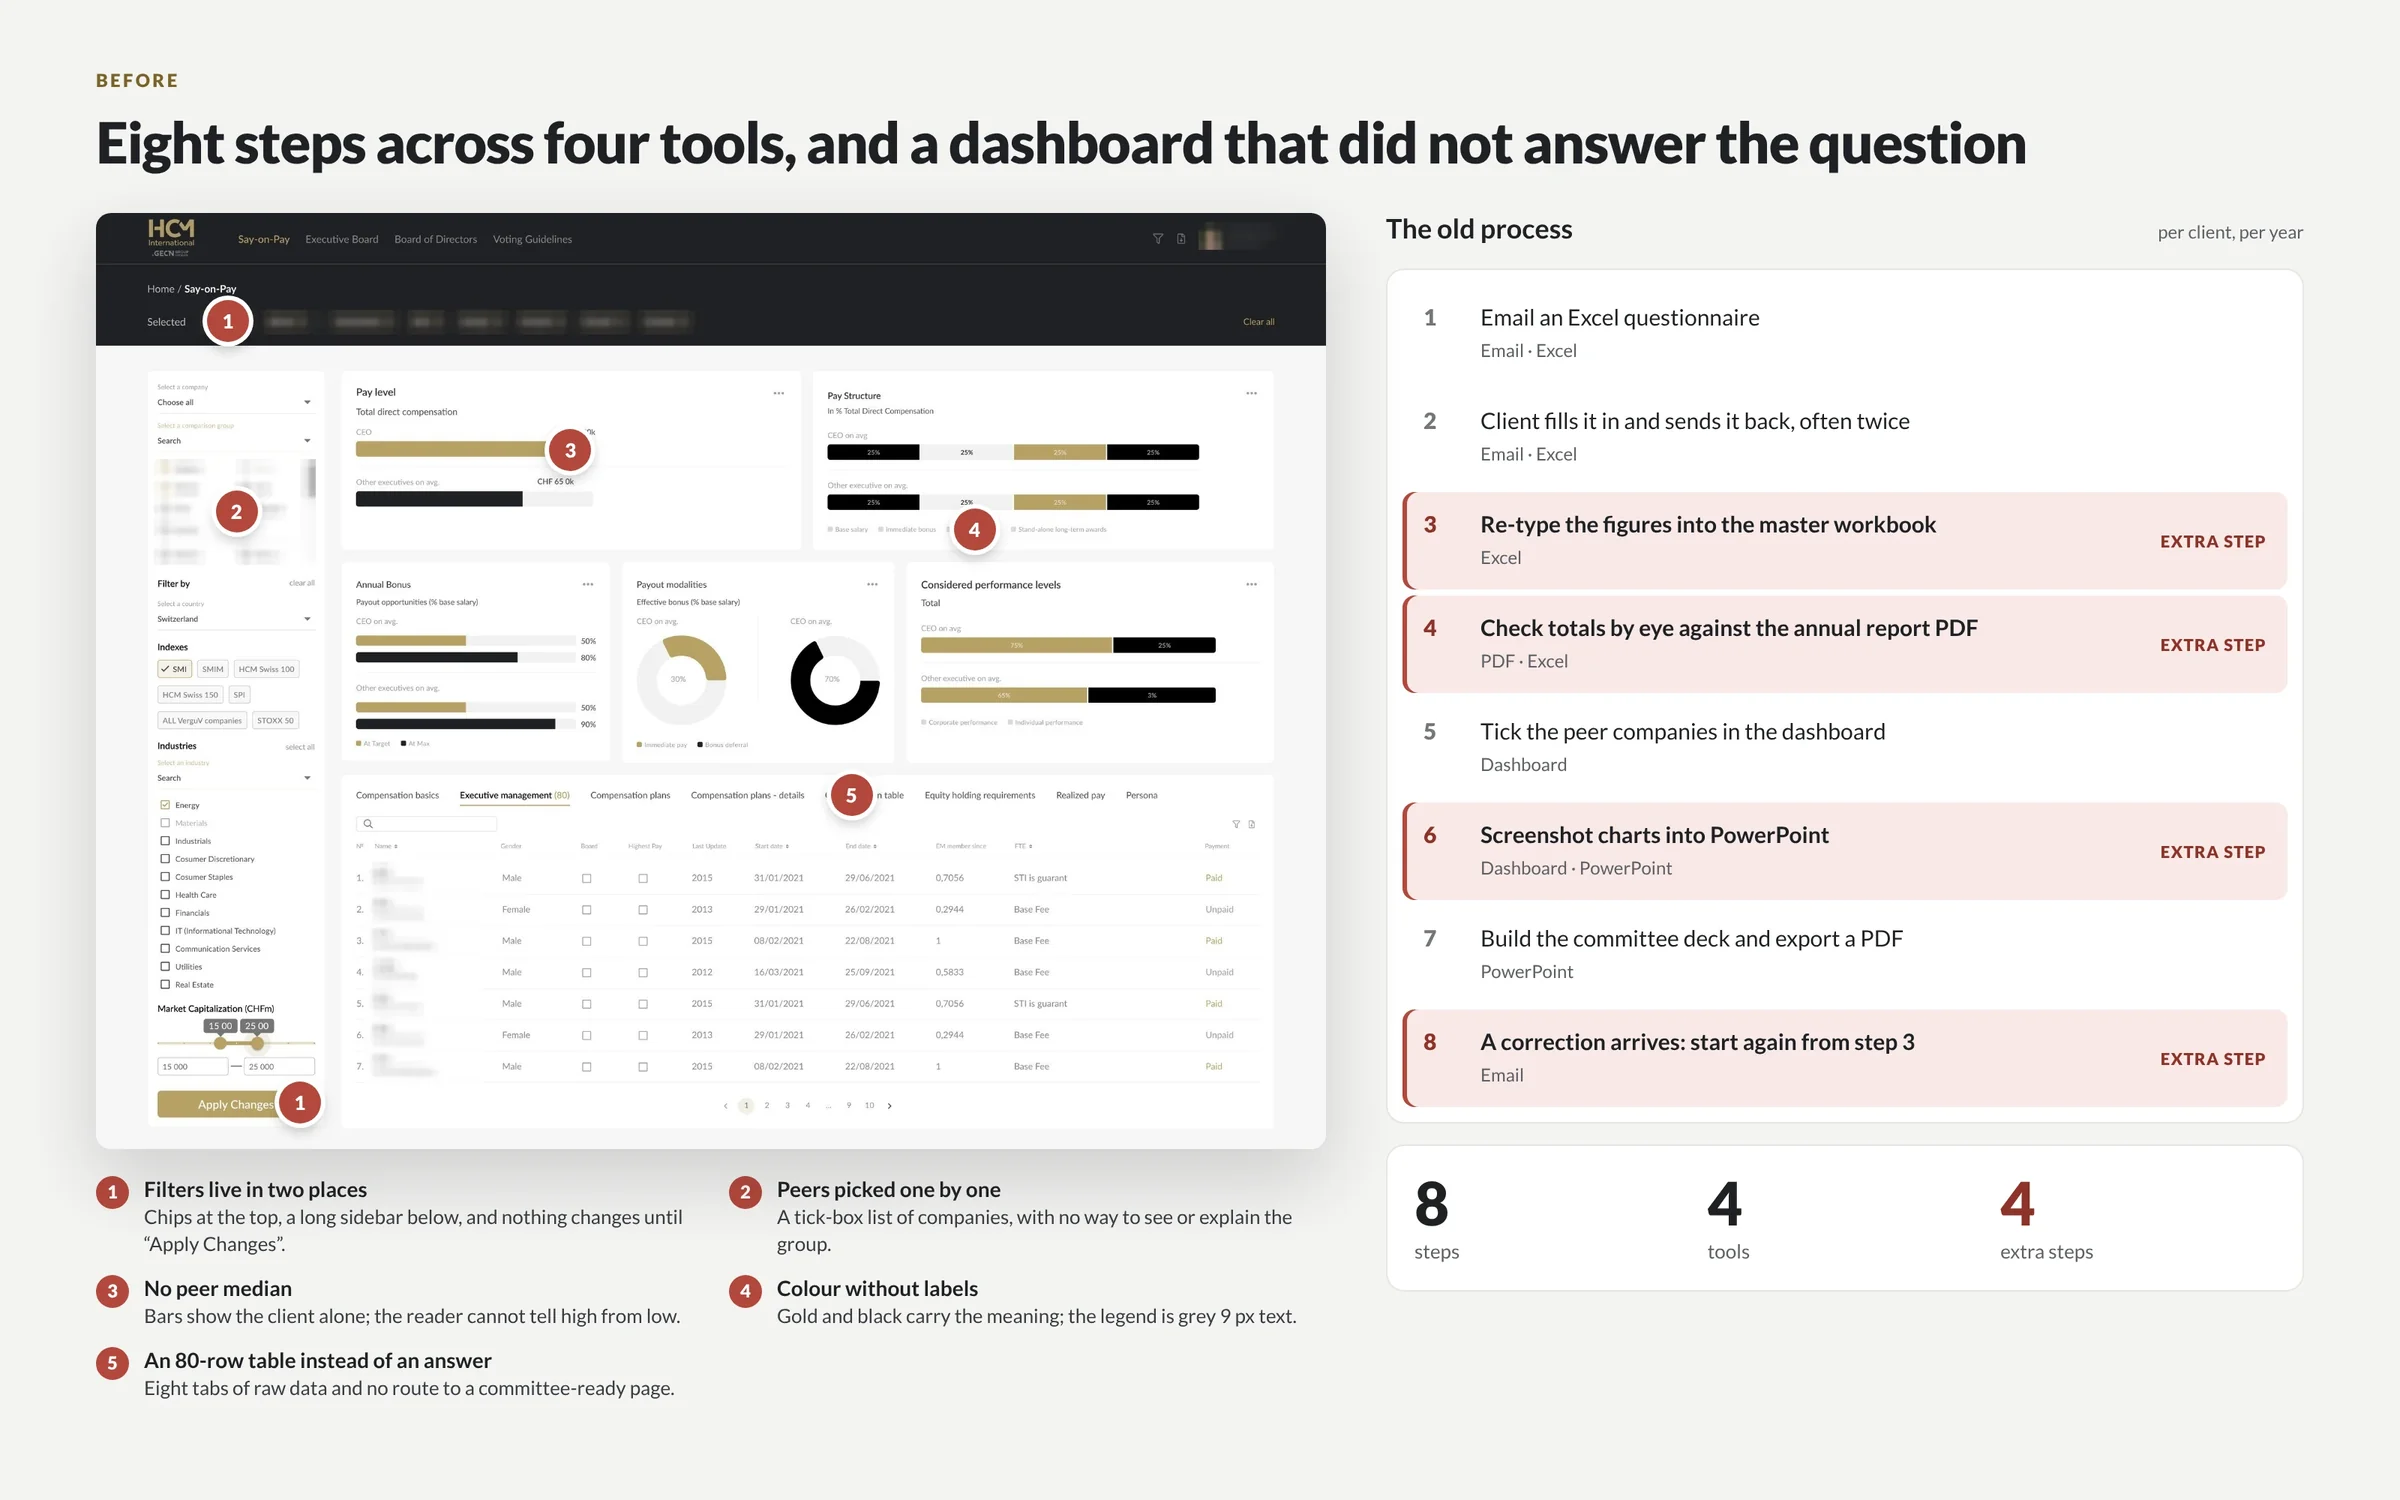
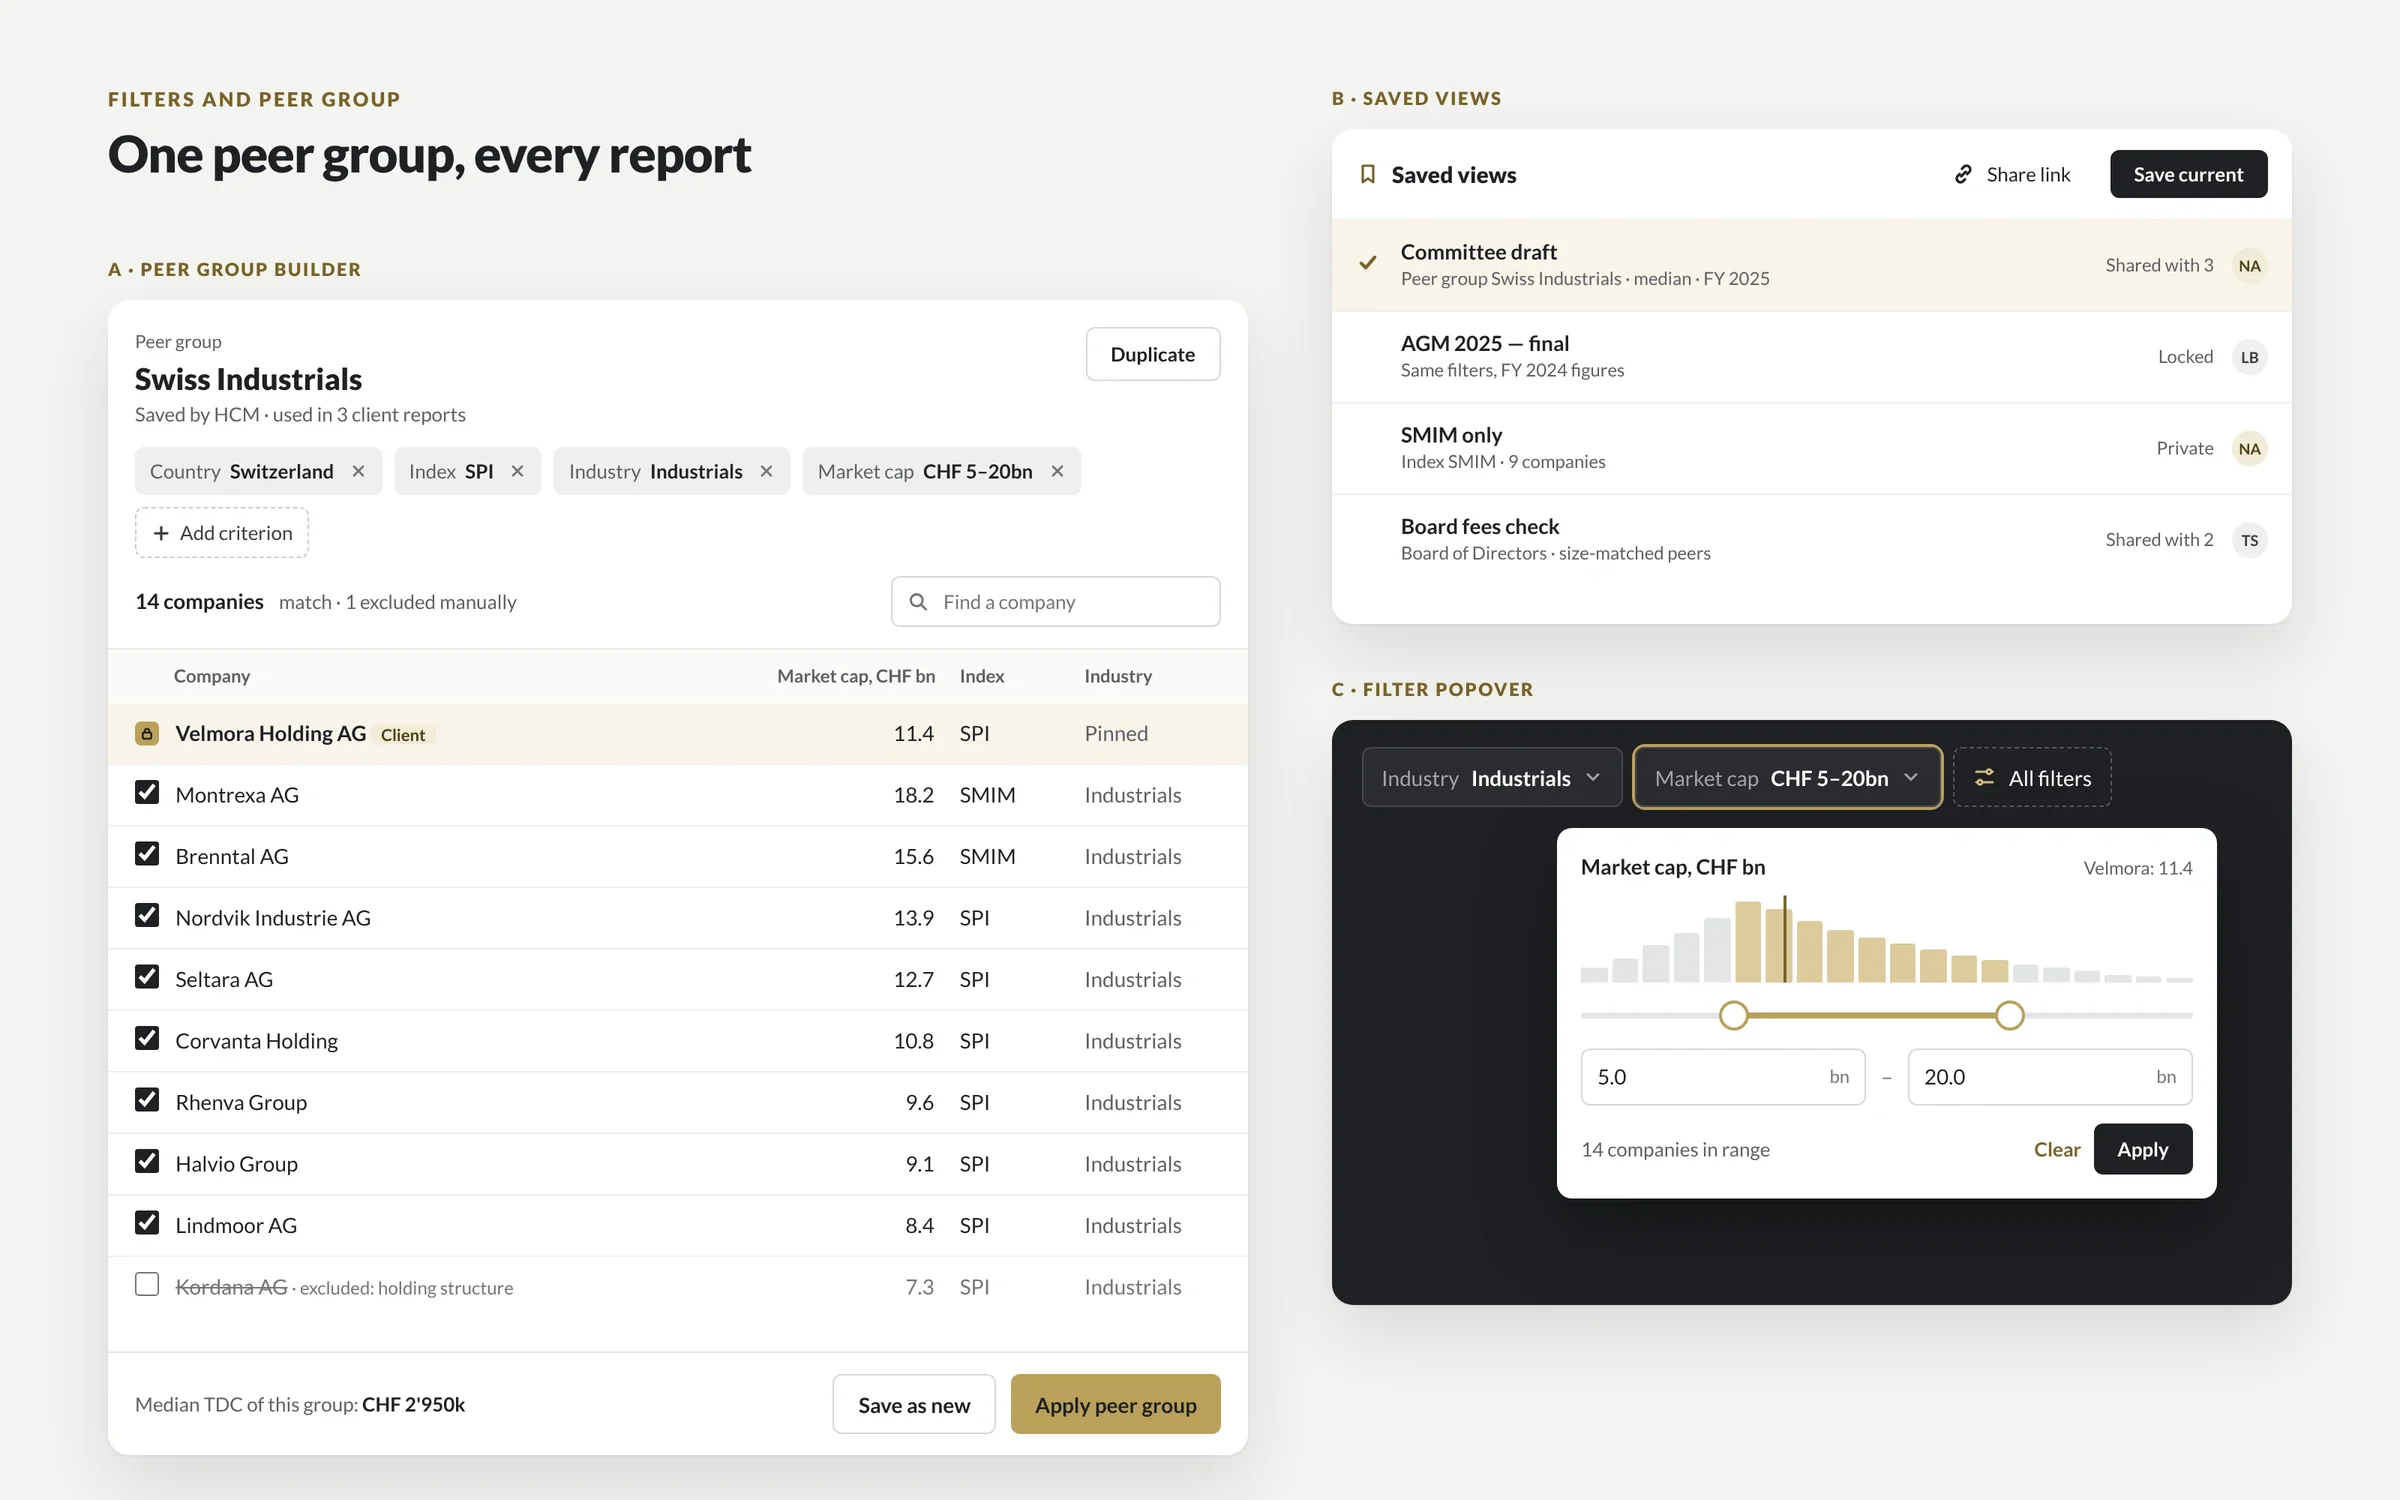
By auditing the real path first. Two DIXI designers mapped how consultants turned client data into a committee report: eight steps across email, Excel, a dashboard and PowerPoint, four of them extra. We removed the redundant data-entry loops, rebuilt the platform around one flow (pick the companies, compare, save the view, export) and gave the data work its own connected app.
| Client | What we redesigned | Before | After | Source |
|---|---|---|---|---|
| HCM International · executive pay advisory | Reporting platform, internal data app, design system, identity, website | 8 steps across email, Excel, a dashboard and PowerPoint; few users reached a finished report | 4 steps in one platform; 22% more users reach a finished report; core tasks take 35% less time | HCM case |
| EW · workflow SaaS | Platform designed and built from scratch | No product yet | $50K MRR in the first 6 months | Client-reported |
| ComboCurve · upstream oil and gas SaaS | Features across forecasting, type curves, economics, scheduling and the map; the design system | 170+ companies at its Series B (2022) | 400+ energy companies; economics on up to 75,000 wells at once | ComboCurve case, ComboCurve |
| Koyfin · investment research | 8 core web features, a native mobile app from zero, the design system | 100K users (2020) | 300K+ users by 2022; 500K by 2023 | Koyfin case |
Client milestones are the work of each client’s whole team, of which design was one part. Checked 31 October 2026.

“As we prepared for the relaunch, we needed to simplify a product that had become increasingly complex. Ignat helped improve clarity, streamline key workflows and create a much stronger experience for our users.”
Olga Beregova · Partner, HCM
In stages, never as a big-bang relaunch. We audit how people really work, including the workarounds and unwritten rules, then build the design system, then redesign one module at a time behind feature flags. Old and new versions run side by side until adoption numbers say it is safe to switch, so users keep working while the product changes underneath them.
Sessions with power users, support tickets and exports: where people drop off, and which workarounds and unwritten rules the new design must keep.
Tokens, data formats, one table and one chart grammar, so every redesigned module looks and behaves the same from the first release.
The workflow with the most drop-off goes first. Each module ships on its own, so a mistake stays small and reversible.
Old and new versions side by side behind feature flags. Teams switch when ready, and the old version stays one switch away.
Completion, time on task and support tickets, compared with the baseline we measured in the audit.
“Most enterprise UX projects fail in build collaboration rather than in design,” writes Fuselab Creative. That is why our designers review the build with your engineers, or build the front end themselves.
Enterprise UX serves people who must use the product every day; marketing UX serves buyers deciding whether to book a demo. The first is judged by task completion, accuracy and adoption across roles, the second by conversion. Different users, data, permissions and risks call for different methods, even when the same company pays for both.
| Enterprise product UX (this page) | SaaS marketing UX | |
|---|---|---|
| Who uses it | Required daily users in several roles: analysts, managers, admins, auditors | Buyers comparing vendors, often for a few minutes |
| Data | Thousands of records, dense tables, live and stale states | A few claims, proof points and numbers |
| Roles and permissions | What each role can see, edit, approve and export | One audience per page |
| How it is bought | Procurement, security review, multi-year renewals | Self-serve sign-up or a demo request |
| Success metric | Completion, time on task, adoption, support load | Demo requests and pipeline |
| Cost of a mistake | Wrong numbers in a decision, a failed audit, a lost renewal | A lower conversion rate |
| First deliverable | An audit of real user paths | A message and a page structure |
| Where to read more | This page | B2B SaaS web design |
Need both? The same team redesigns the product and the site that sells it: B2B SaaS web design and the Conversion Sprint.
With hierarchy rather than less data. Each screen opens with the answer a role needs, then lets people drill into the records behind it. Tables get density modes, frozen columns, saved views and bulk actions. Dashboards get one chart grammar, with a table behind every chart. Permissions decide what each role sees, edits and approves, and every change leaves an audit trail.
Compact, default and comfortable rows, frozen identifiers, keyboard paths and bulk actions on hundreds of rows at once.
The figure a role checks every morning sits on top. Details open on demand, never as a wall of widgets.
The same numbers one click away, as in HCM’s reports, so nobody has to rebuild a chart in Excel.
Filters, columns and peer groups saved per user and shared with the team, so an analysis opens the way you left it.
An analyst, a manager and an admin start in different places, built from the same components.
Who can see, edit, approve and export; masked sensitive fields; a readable history of every change.
We design to WCAG 2.2 AA, set performance budgets for heavy tables and charts, and use patterns that pass security review: role-based visibility, masked sensitive fields, session handling and audit trails. If you sell to US state or local government, the ADA Title II rule now requires WCAG 2.1 AA, by April 26, 2027 for large entities and April 26, 2028 for smaller ones.
Senior people you meet on the first call. Ignat, DIXI’s founder, leads every engagement. Two senior designers ran HCM’s 5–6-month redesign, embedded with its partners, and front-end developers join when we build. There is no junior hand-off after the pitch. We overlap with US and European working hours and work in your tools: Figma, your tracker, your standups.
A project redesigns a defined scope, from one dashboard to a full platform. A design partner joins your product team release after release, as we did at ComboCurve and Koyfin. A Conversion Sprint redesigns the page that sells the product.
Audit and redesign of your homepage or key page: message, structure, proof.
Full website or product redesign, with a design system your team can grow.
Ongoing product and web design, experiments and monthly reviews.
A bigger scope, several services at once or a different timeline. We will shape the format and the price around your project.
With DIXI, a scoped redesign project starts at $12k and runs 6–10 weeks, and a design partnership starts at $6k a month for at least three months. A focused dashboard takes weeks, a full platform months: HCM’s reporting platform, internal app and design system took 5–6 months. Published enterprise agency prices run from $10k minimums to $450k programs.
| Option | Published price | Timeline | Scope | Source |
|---|---|---|---|---|
| DIXI · Project | From $12k | 6–10 weeks per scope; a full platform like HCM’s, 5–6 months | Audit, workflows, UI, design system, specs; front-end build optional | DIXI |
| DIXI · Design partner | From $6k a month | At least 3 months, then month to month | Senior designers inside your product team, release after release | DIXI |
| Fuselab Creative | $40k (discovery and audit) to $450k (multi-role engagement); partnerships $35k–$80k a month | 4–15 months | Enterprise UX research and design, build collaboration | Fuselab |
| Enterprise UX agencies on Clutch | Minimum project $10k (Cieden, UX Studio, Qubstudio) or $25k (Fuselab, Neuron, Momentum Design Lab, Fuzzy Math) | Not published | Varies by agency | Fuselab’s list, citing Clutch |
| Dashboard redesign at Seed or Series A | $4k–$25k | 3–6 weeks for one dashboard; 8–16+ weeks for a multi-role suite | Dashboard, data states, sometimes a design system | 925Studios |
Third-party prices as published on each source, checked 31 October 2026. Full DIXI formats: see pricing.
Pick by where the risk sits. An in-house team knows the product but takes months to hire and rarely has redesign experience. A large enterprise agency brings process at enterprise prices. A freelancer suits one contained screen. A senior studio fits when you need research, UI, a design system and front-end at once, without a long ramp-up.
| Option | Senior people on the work | Design and build | Ramp-up | Best for |
|---|---|---|---|---|
| In-house design team | Depends on who you can hire | Your engineers build | Months to hire, then deep product knowledge | A steady roadmap on one product |
| Large enterprise UX agency | Senior leads, mixed delivery team | Often handed to your engineers or a partner | Weeks of discovery | Multi-year programs with large budgets |
| Freelancer | One person | Your engineers build | Days | One contained screen or task |
| Dev shop with designers | Varies | Build-led | Weeks | Build-heavy projects where design is secondary |
| DIXI | Founder-led; the people on the first call do the work | Design and front-end in one team, or a full handoff with build reviews | Starts after a 25-minute call and a written plan | Data-heavy products that need a redesign without a big-bang relaunch |
Websites in Webflow, Framer, Astro and Shopify. Products in React, Next.js and React Native.
 Webflow
 Framer
 Astro
 Shopify
 React
 Next.js
 React Native
 Swift
 Figma
 Cloudflare

I'm Ignat, and you work with me directly: no account managers and no handoffs, just a senior team that designs and builds your site.
Enterprise UX design is the design of software people use at work every day because their job requires it: reporting platforms, dashboards, internal tools and workflow systems. It deals with dense data, several roles and permissions, long-held habits and expensive mistakes, so it is judged by task completion, accuracy and adoption rather than by conversion.
Most B2B SaaS UX work is about winning and activating users who could leave. Enterprise UX serves people who are required to use the product, often in several roles with different permissions, on sensitive data, inside a long procurement and renewal cycle. That changes the method: audit real user paths first, design for roles, and roll out in stages.
With DIXI, projects start at $12k and design partnerships at $6k a month. Published market prices run from $4k–$25k for a dashboard at Seed or Series A (925Studios) to $40k–$450k for enterprise programs at Fuselab Creative. See pricing for what is included and what changes a quote.
A single dashboard takes weeks, a scoped project 6–10 weeks and a full platform several months. HCM International’s reporting platform, internal data app and design system took 5–6 months from the first audit to the relaunch, with two senior DIXI designers and HCM’s own developers building it.
Yes, and we recommend it. After the audit and the design system, we redesign one module at a time, starting where users drop off most, and ship behind feature flags so the old and new versions can run side by side. Adoption is measured at 30, 60 and 90 days against the baseline from the audit.
Both. For HCM International we handed specs, states and components to HCM’s in-house developers and reviewed the build with them. For EW, a workflow SaaS that reached $50K MRR in its first 6 months, we designed and built the platform. Either way, you own every design file and every line of code.
We map who needs to see, edit, approve and export what, then design role-based home screens from shared components, so an analyst, a manager and an admin each start where their work starts. Sensitive fields can be masked, and every change lands in an audit trail that people can actually read.
With hierarchy, not by hiding data: answer-first layouts, aligned columns with tabular numbers, color reserved for signals, density modes, frozen identifiers, saved views and a table behind every chart. We design with real-scale data, including long names, missing values and thousands of rows, so problems show up in design review rather than in production.
WCAG 2.2 AA by default. If you sell to US state or local governments, the ADA Title II rule requires WCAG 2.1 AA by April 26, 2027 for entities serving 50,000 or more people and by April 26, 2028 for smaller ones, so public-sector buyers are starting to ask for it in procurement.
Yes. Our longest engagements worked that way: 3.5 years inside ComboCurve’s product team and two years inside Koyfin’s, joining standups, planning, design reviews and build checks. We extend your design system rather than replace it, unless the audit shows the system itself is the problem. See design partner.
Book a 25-minute call with Ignat. You get a written plan and a quote, or start with a free teardown of one dashboard or workflow.
We use essential storage to run this site. With your OK we also use analytics to see which pages help visitors. No ad tracking. Cookie policy
Choose what we can use. You can change this any time from Cookie settings in the footer.
 Ignat · Founder