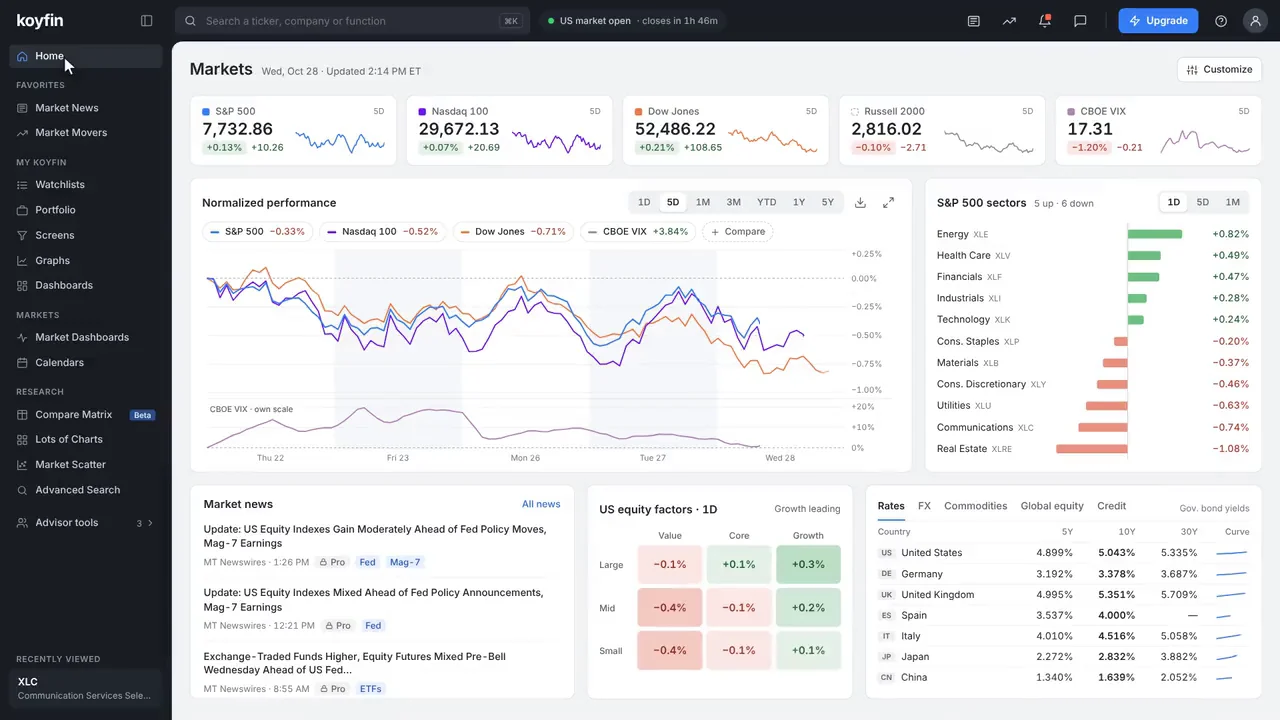


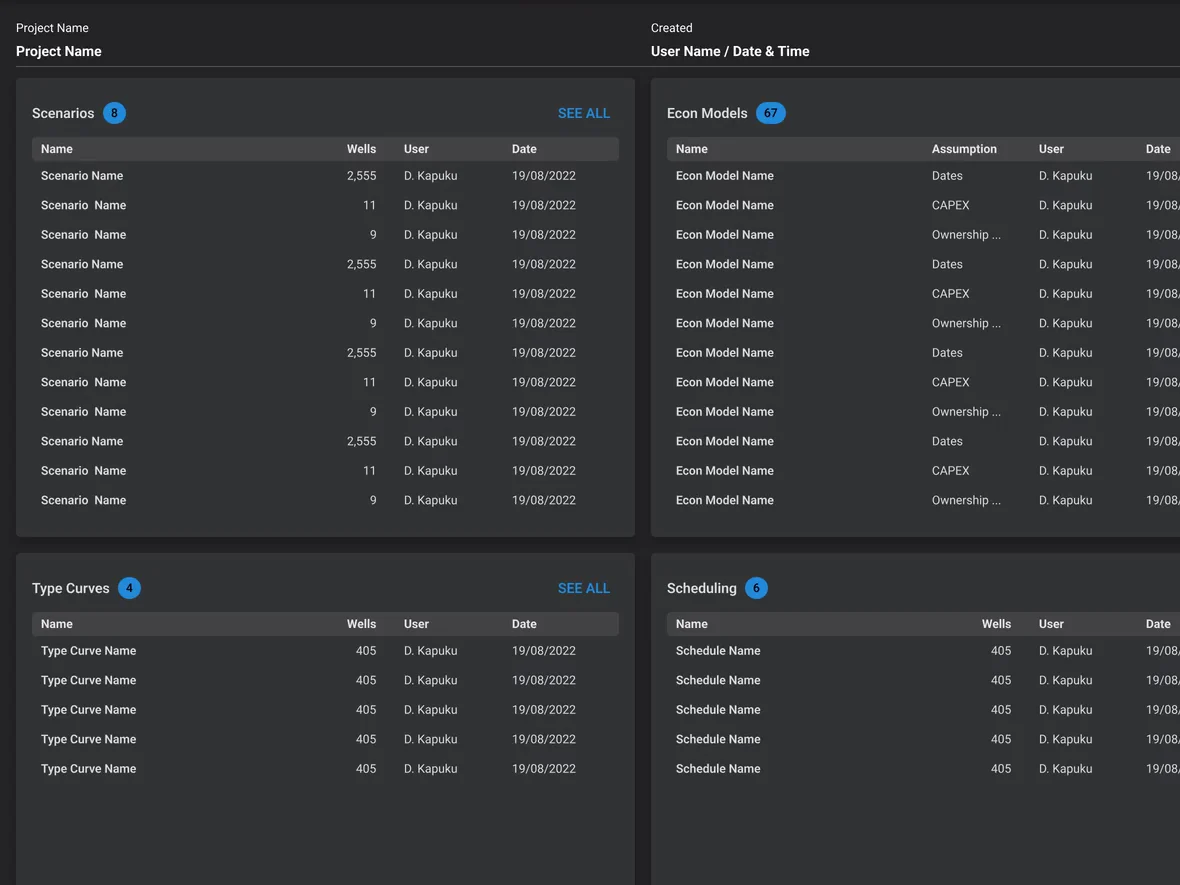
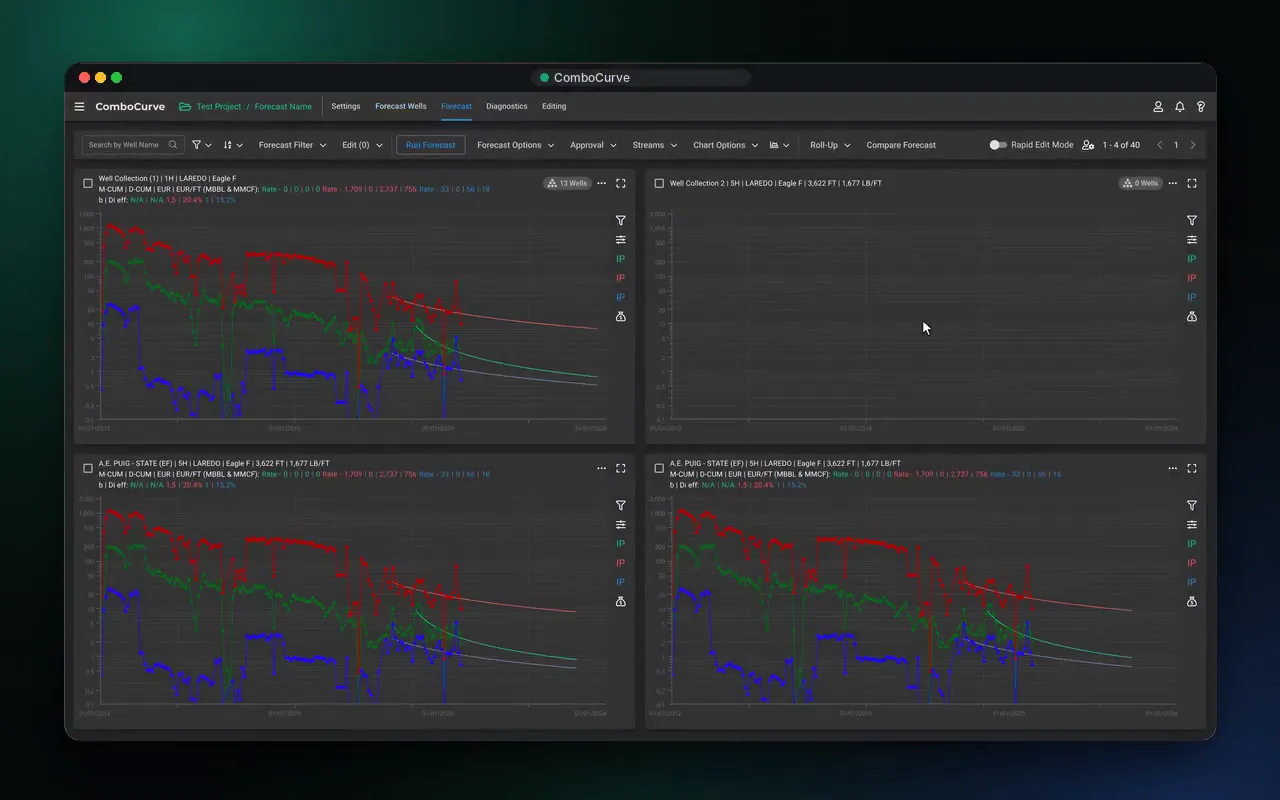
ComboCurve · energy analytics
650%Year-over-year growth at its $50M Series B. We designed features across forecasting, economics, scheduling and the map, and the design system.
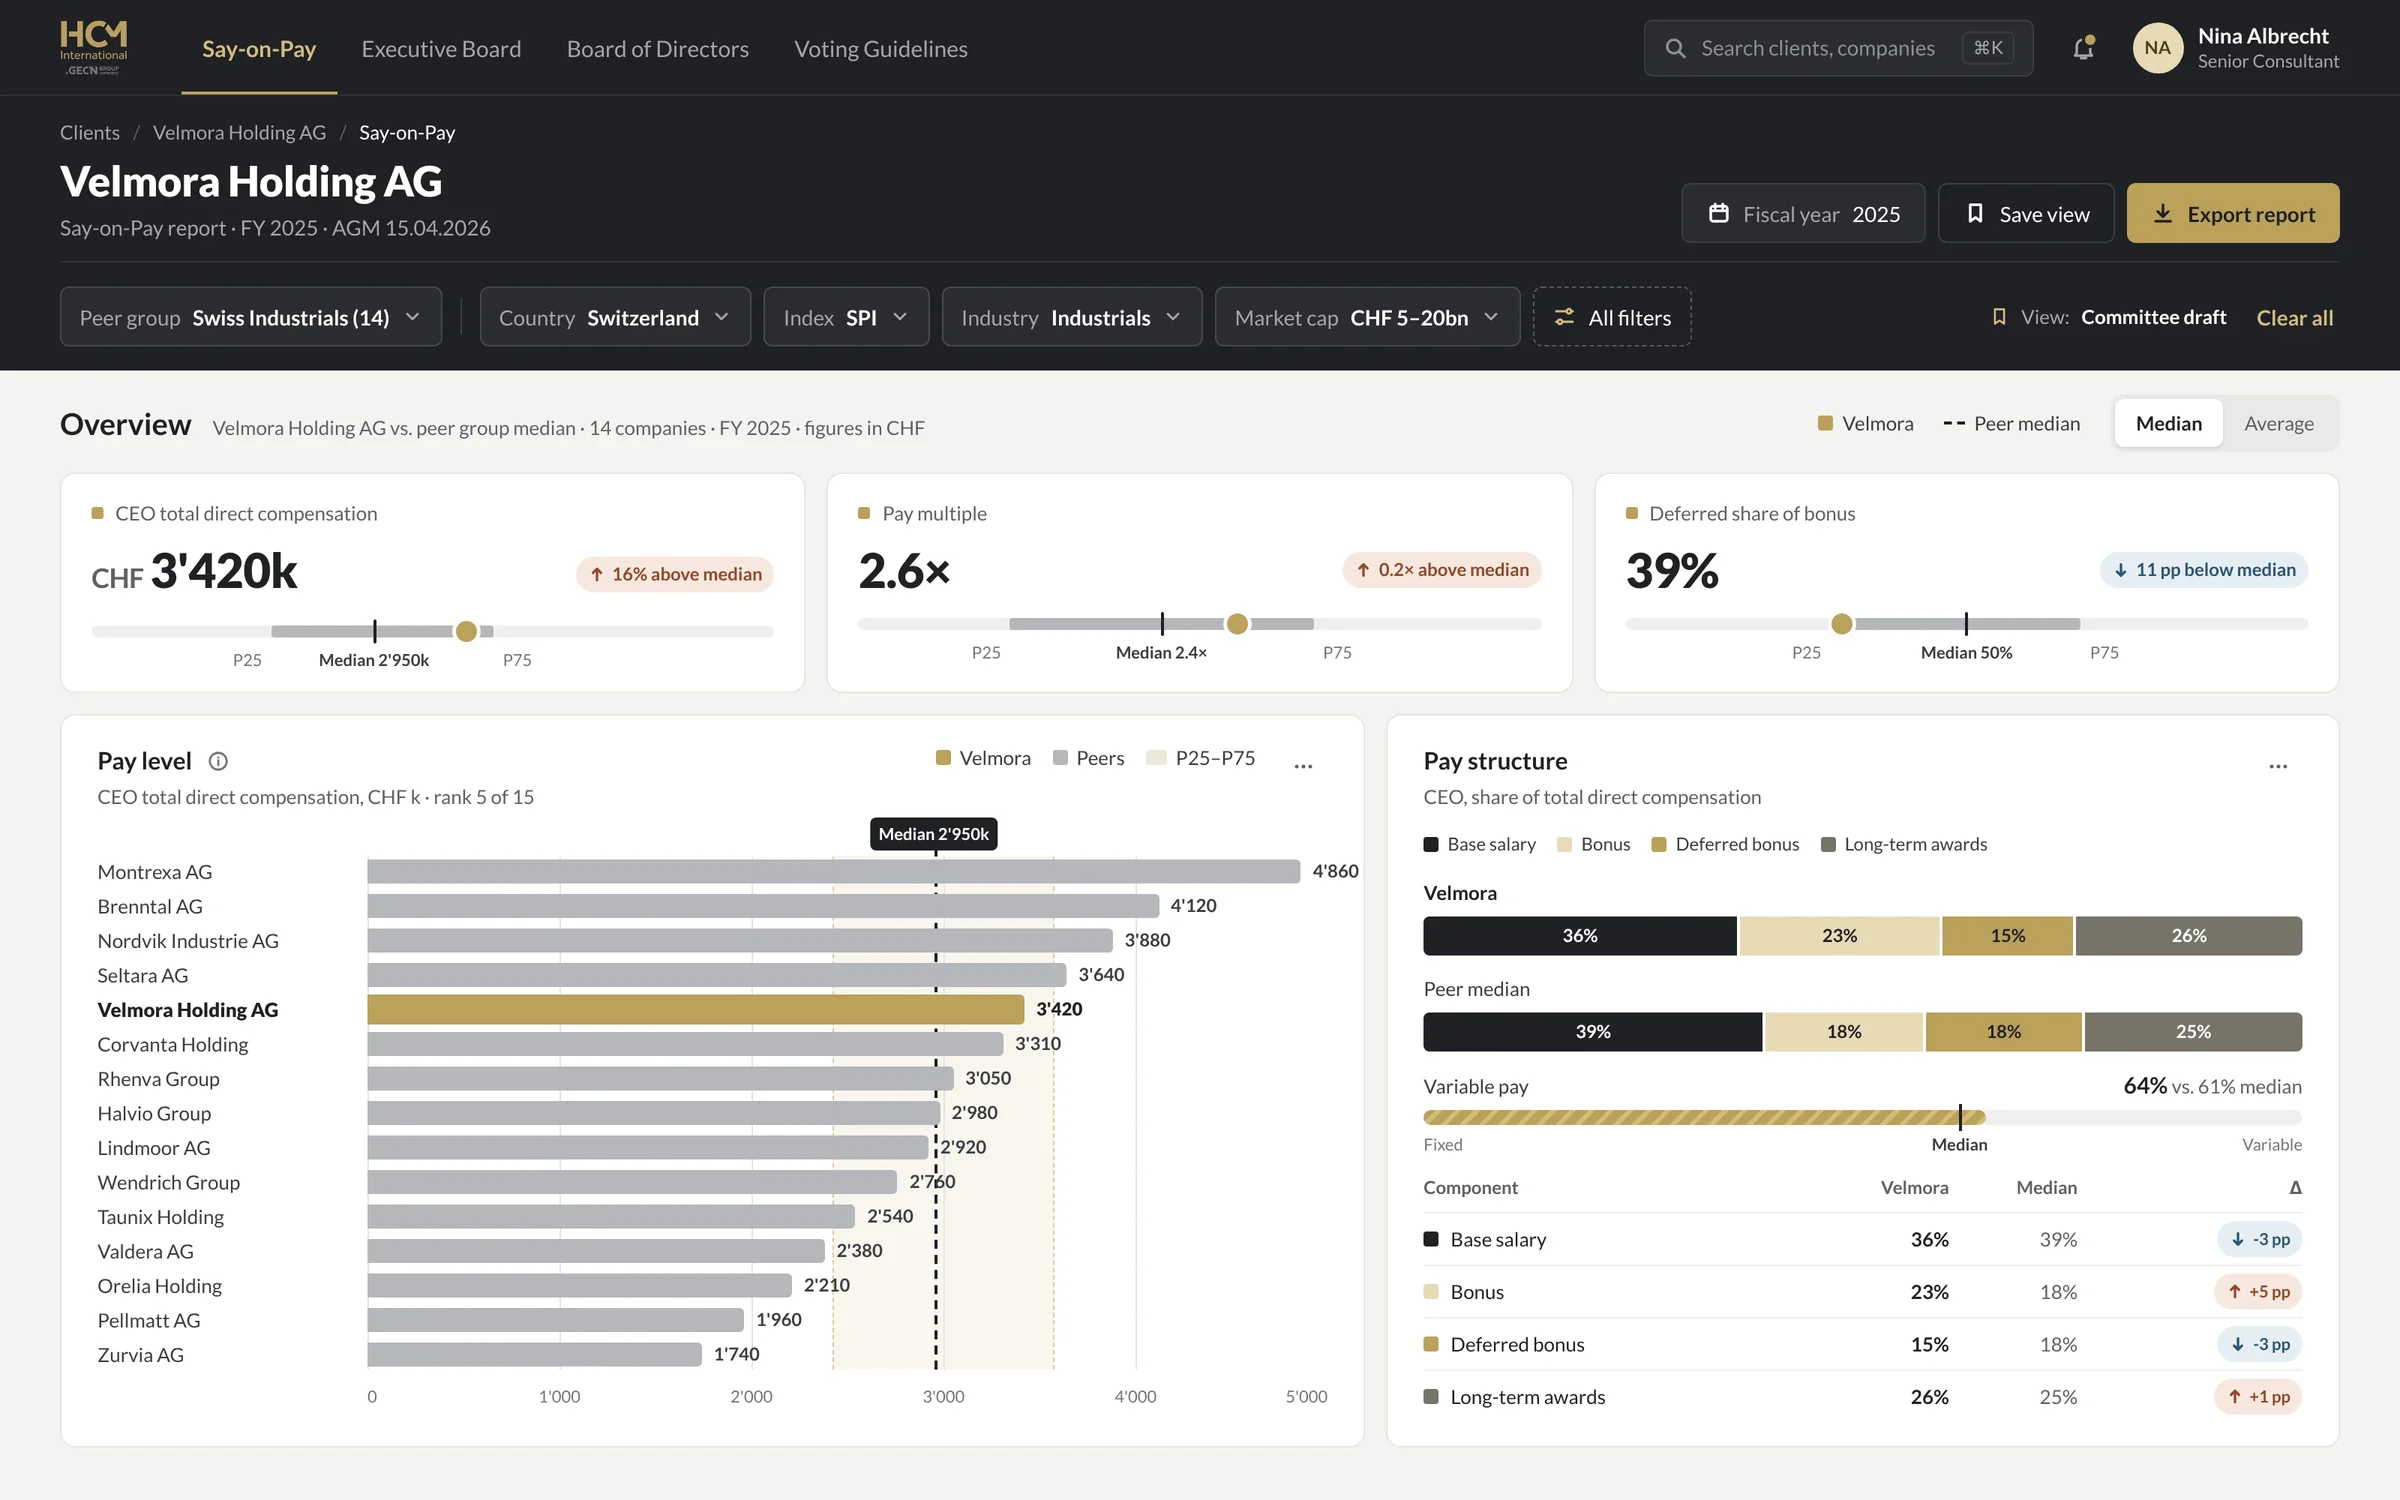
ComboCurve case study →We design dashboards, analytics and reporting UI for SaaS, fintech and energy teams: the number that matters at the top, charts people read without a legend hunt, tables that survive real data, and a design system your engineers build from. Our work includes ComboCurve’s energy analytics platform, Koyfin’s market data app and HCM International’s reporting platform. Projects from $12k.
 By Ignat, founder of DIXI · Updated
Senior product designers who sit with your engineers · design system and chart specs included
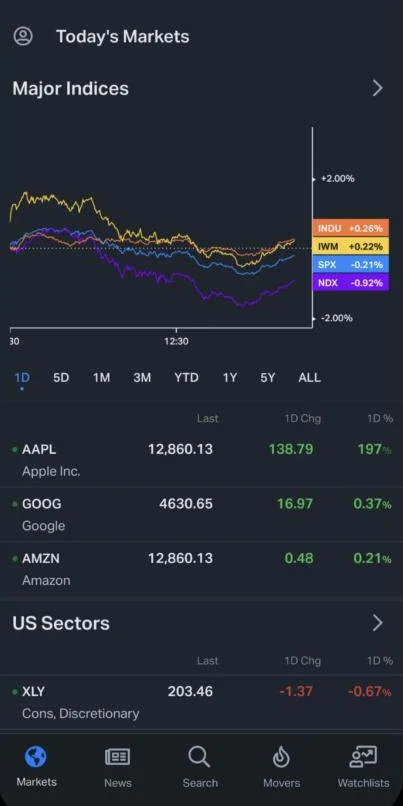
The screens where people read and act on data. We decide which questions each screen answers, pick the chart or table that answers each one, design every state from loading to no-access, and hand engineers a design system with chart specs. The test is simple: a user should know what the top number means, and whether it is good, in a few seconds.
KPIs, trends and drill-downs inside your SaaS, for the people who pay for it.
Reports people build, filter, compare and export, from peer groups to committee PDFs.
Workspaces where teams enter, check and approve data before it reaches a client.
Forecasts, schedules and maps for energy, and market data for finance.
Watchlists, charts and reports sized for one hand, without losing the depth.
Tokens, data components, number formats and chart rules your engineers build from.
Three platforms where the data is the product. We worked inside ComboCurve’s product team for 3.5 years and inside Koyfin’s from 2020 to 2022, and redesigned HCM International’s reporting platform end to end. The numbers below are the clients’ own; their growth is the work of their whole teams, and we were one part of it.
Year-over-year growth at its $50M Series B. We designed features across forecasting, economics, scheduling and the map, and the design system.
ComboCurve case study →Users on the investment research platform. We designed the mobile app from the first screen, core web features and the design systems.
Koyfin case study →More users reach a finished report: eight steps in four tools became four steps in one platform.
HCM case study →
“Over 3 years of collaboration, Ignat played an important role in scaling the product and website while the company grew by 650%. He built our design system and improved key workflows for a platform trusted by 170+ companies.”
Isabel Ramos · UX Architect, ComboCurve
ComboCurve’s growth figure is from its April 2022 Series B release; Koyfin’s user count and HCM’s result are client-reported.
Real screens from the work above, not concept shots. Each one solves a specific reading problem: hundreds of wells at once, a schedule across months, the same data as a chart or a table, a KPI in every state.
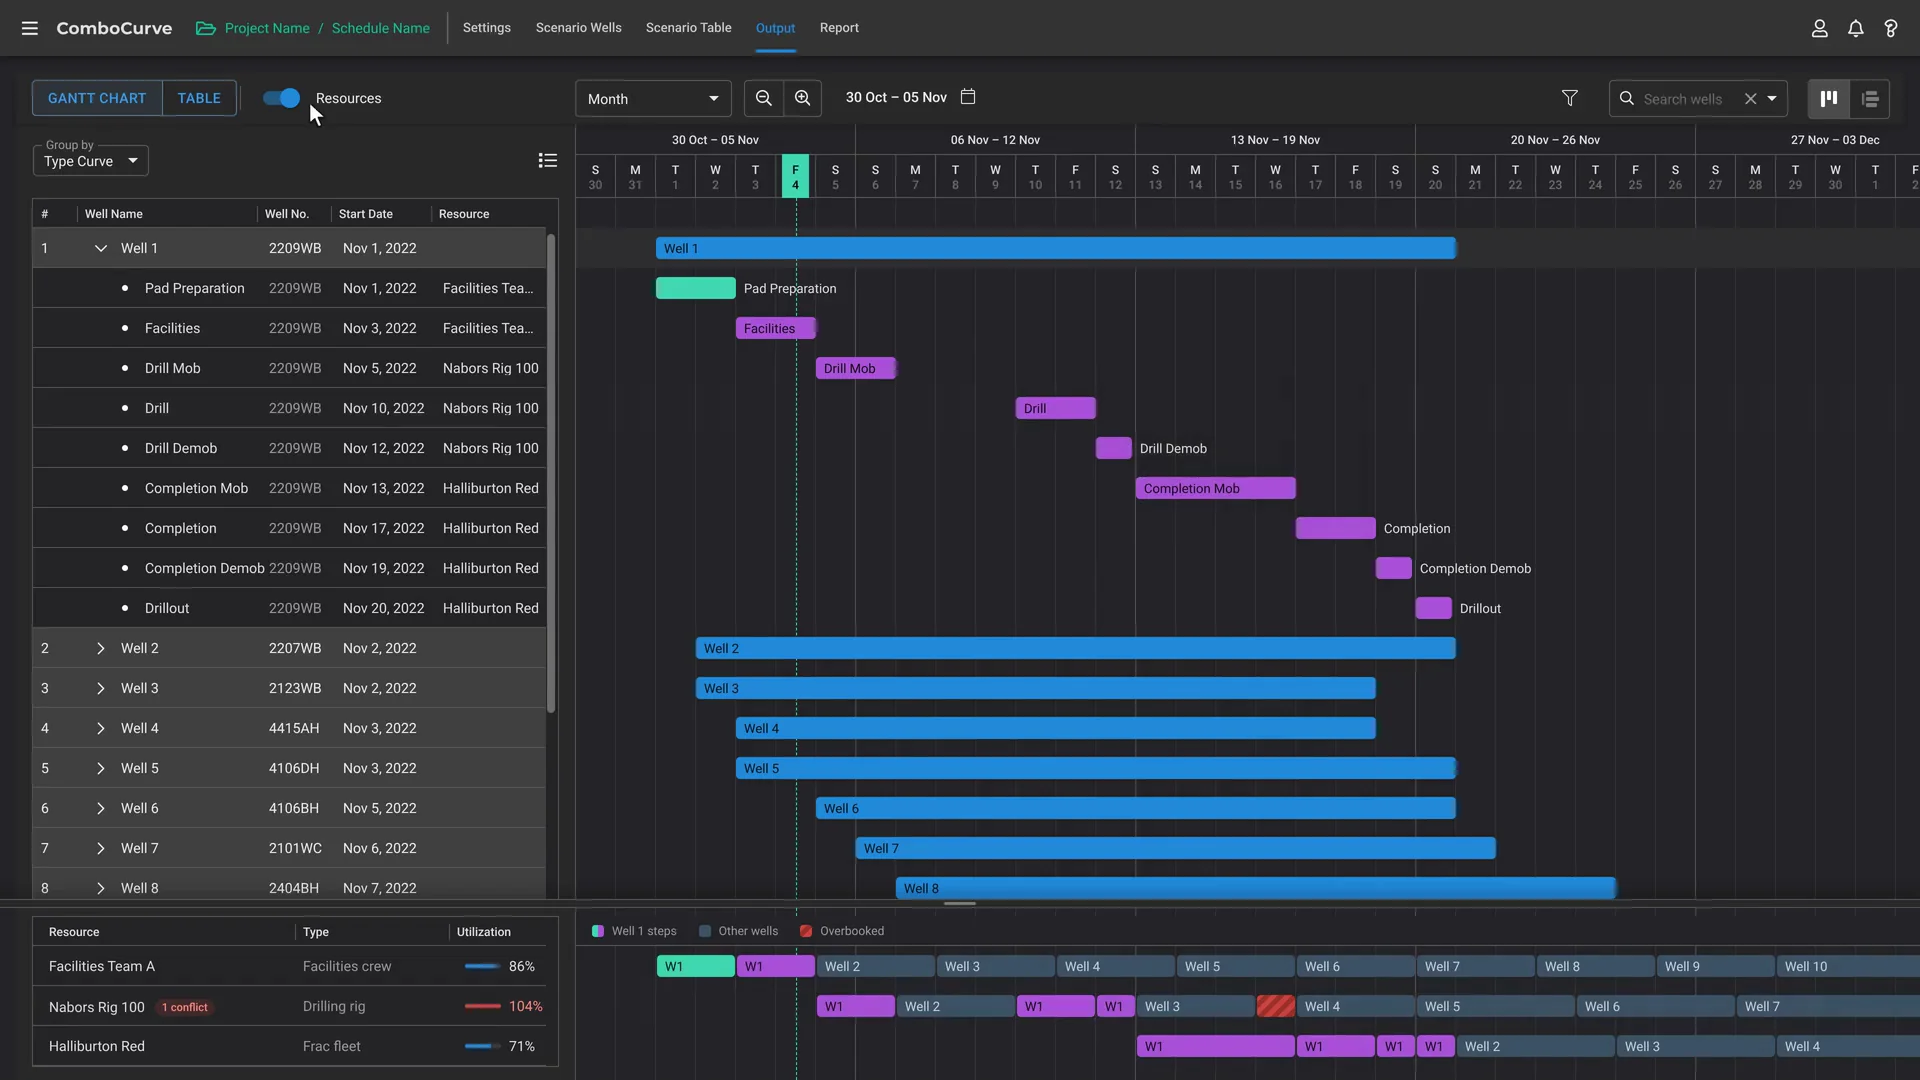
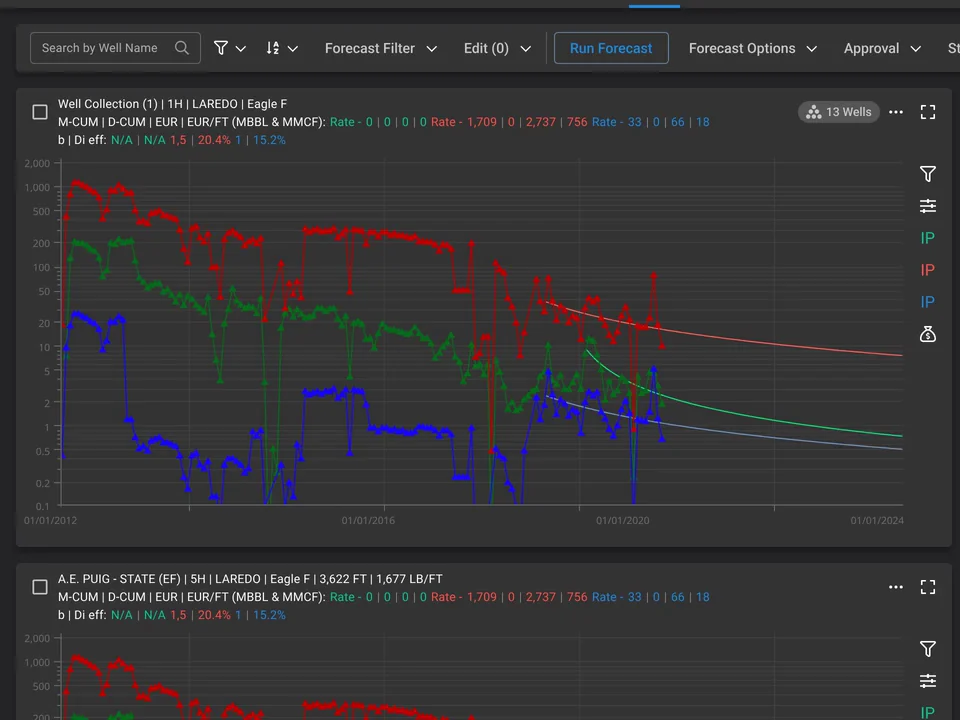
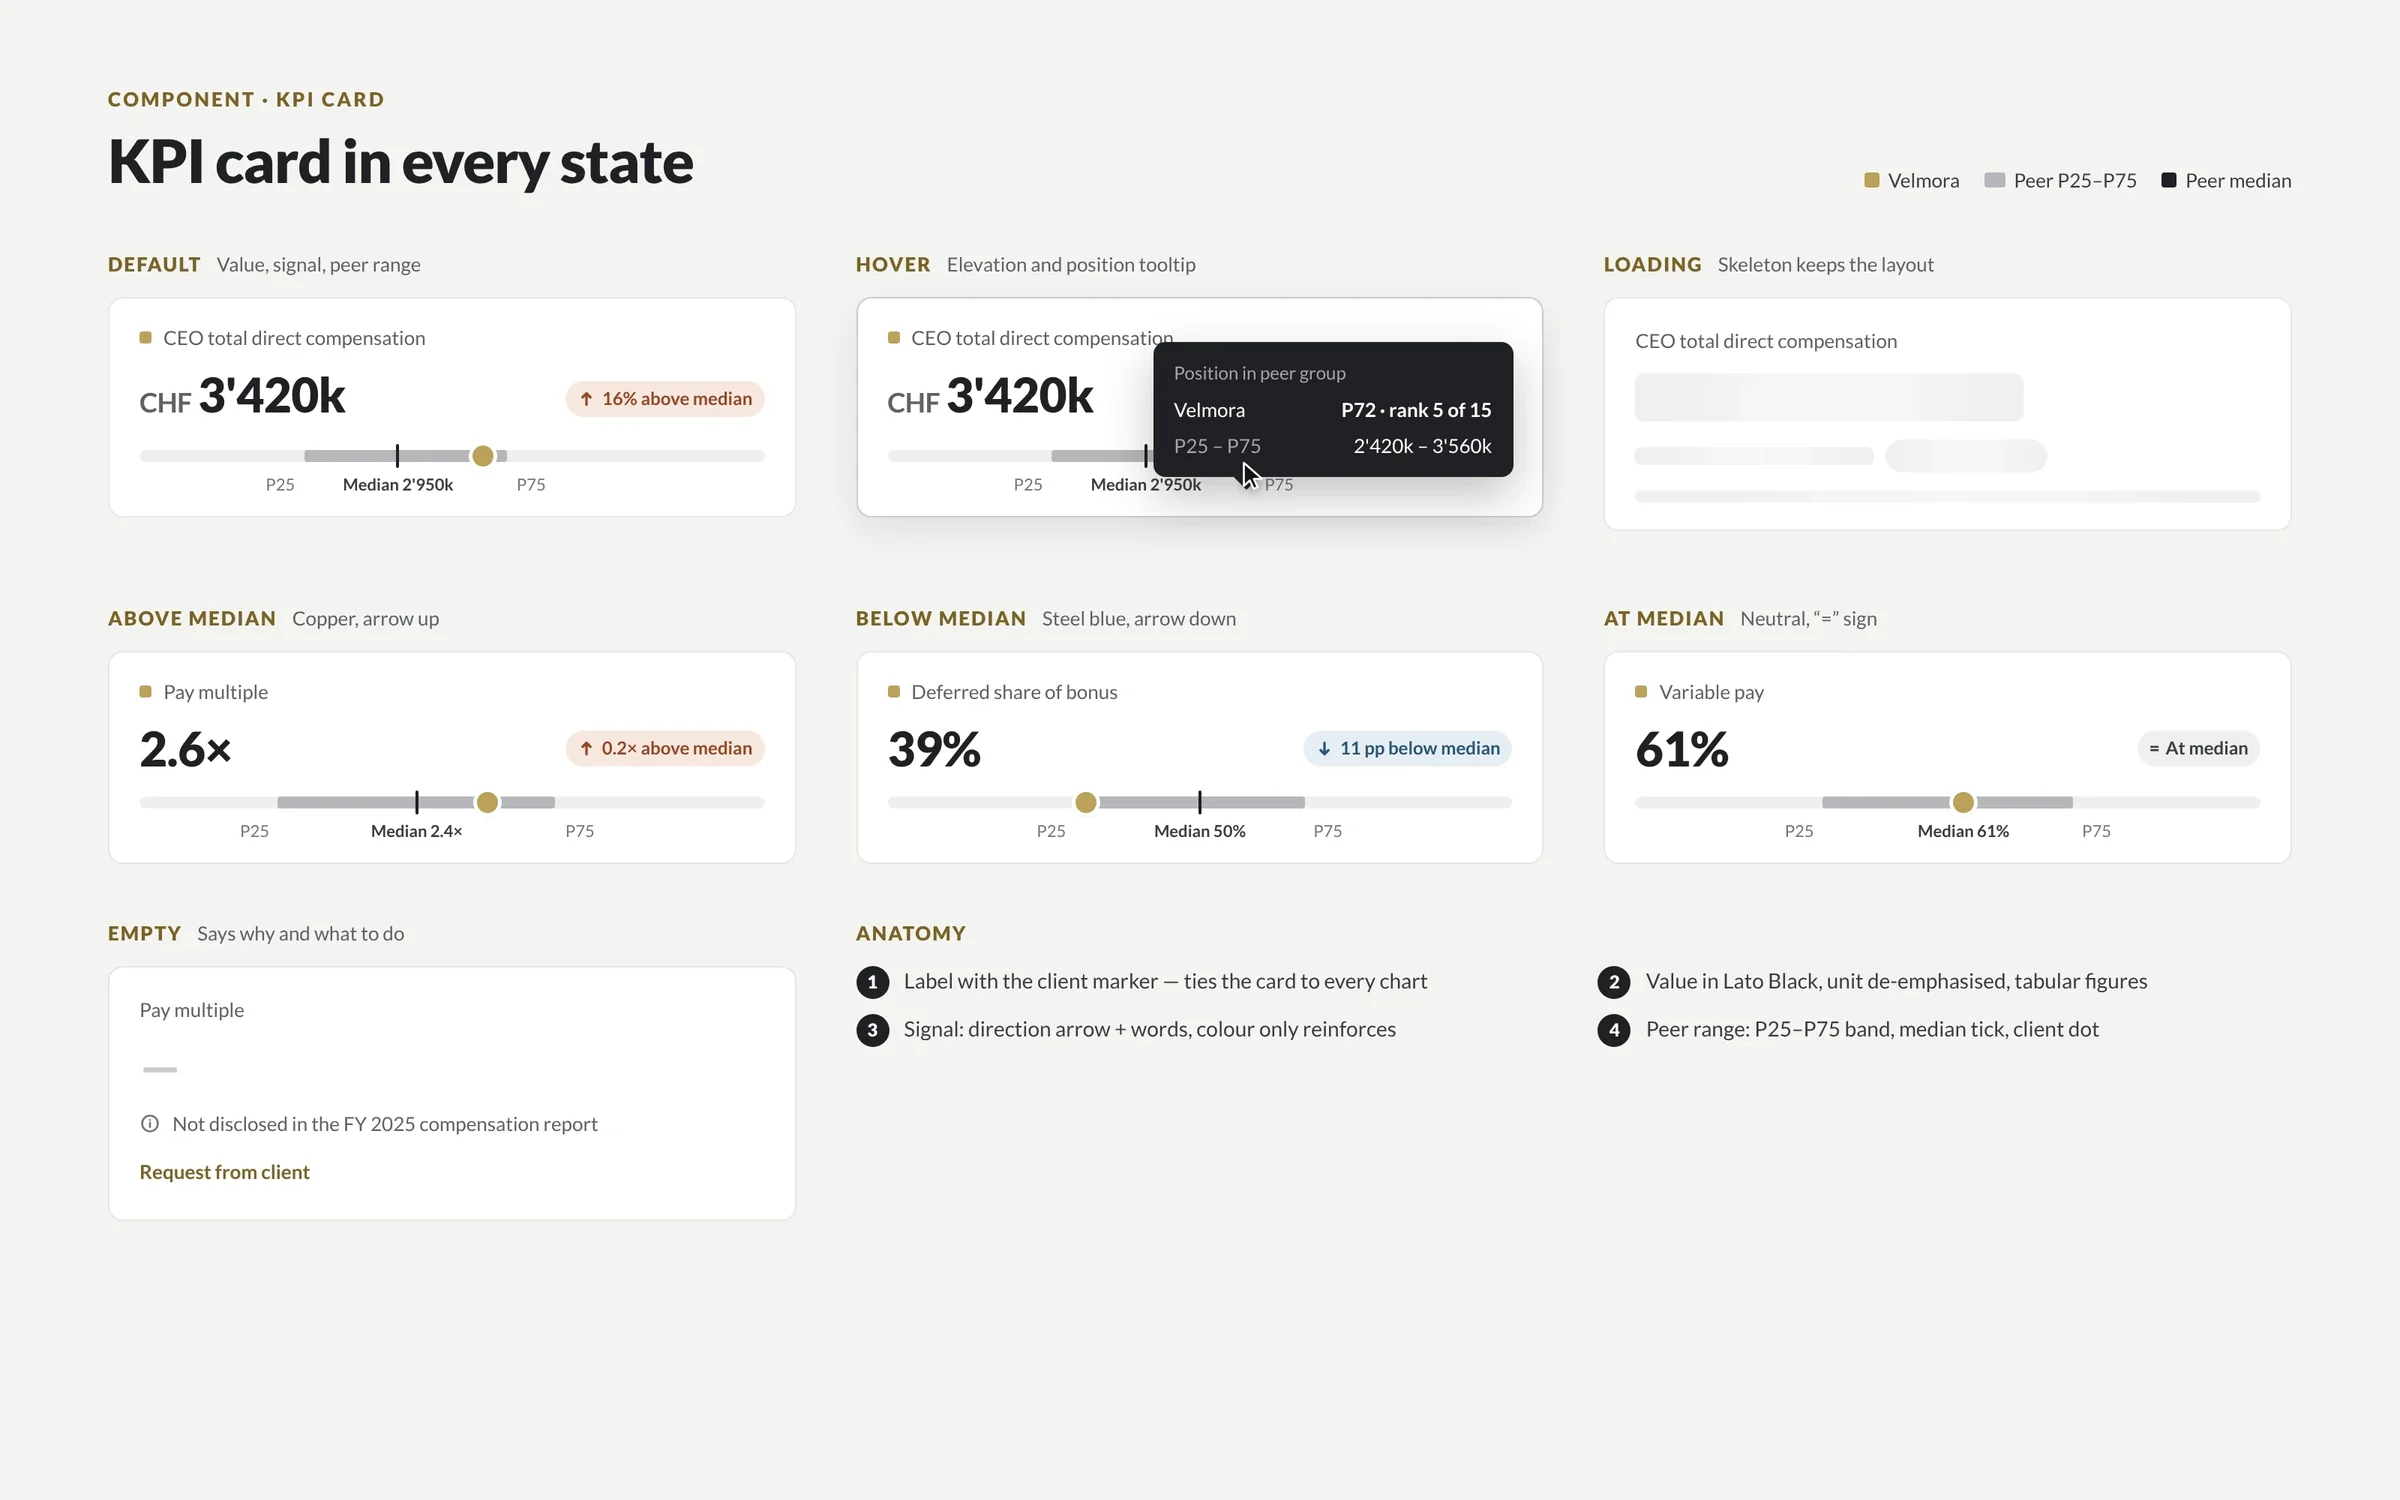
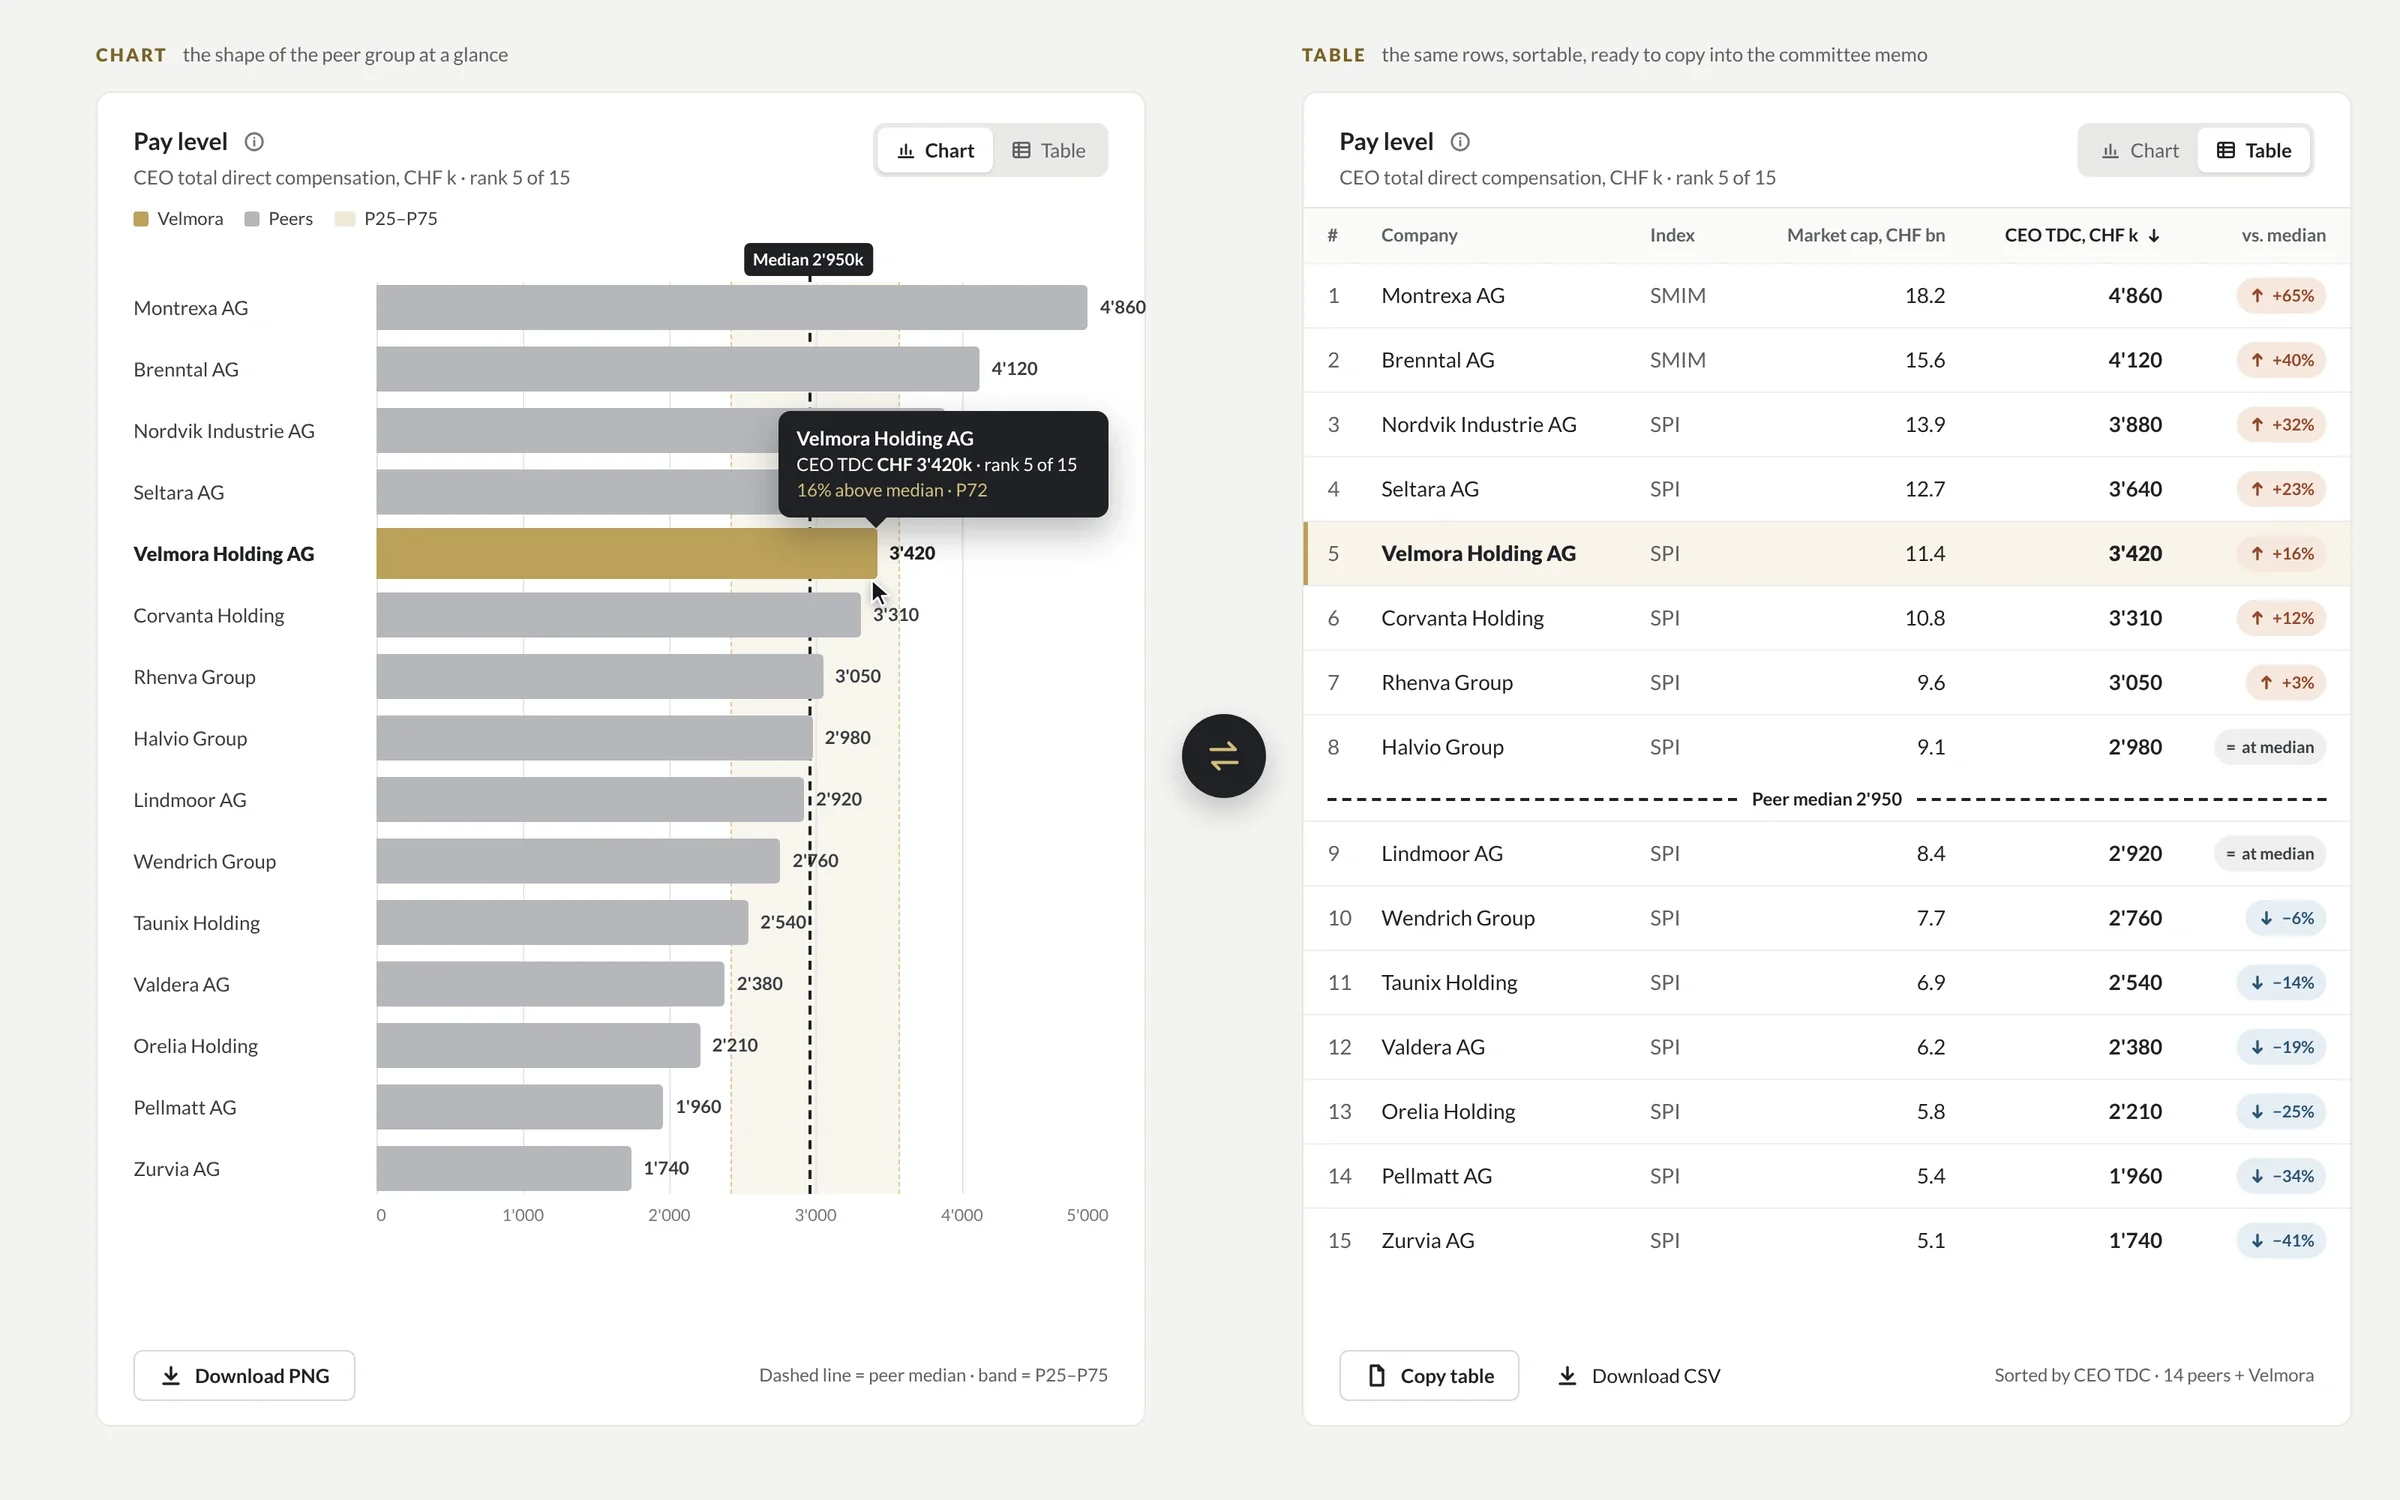
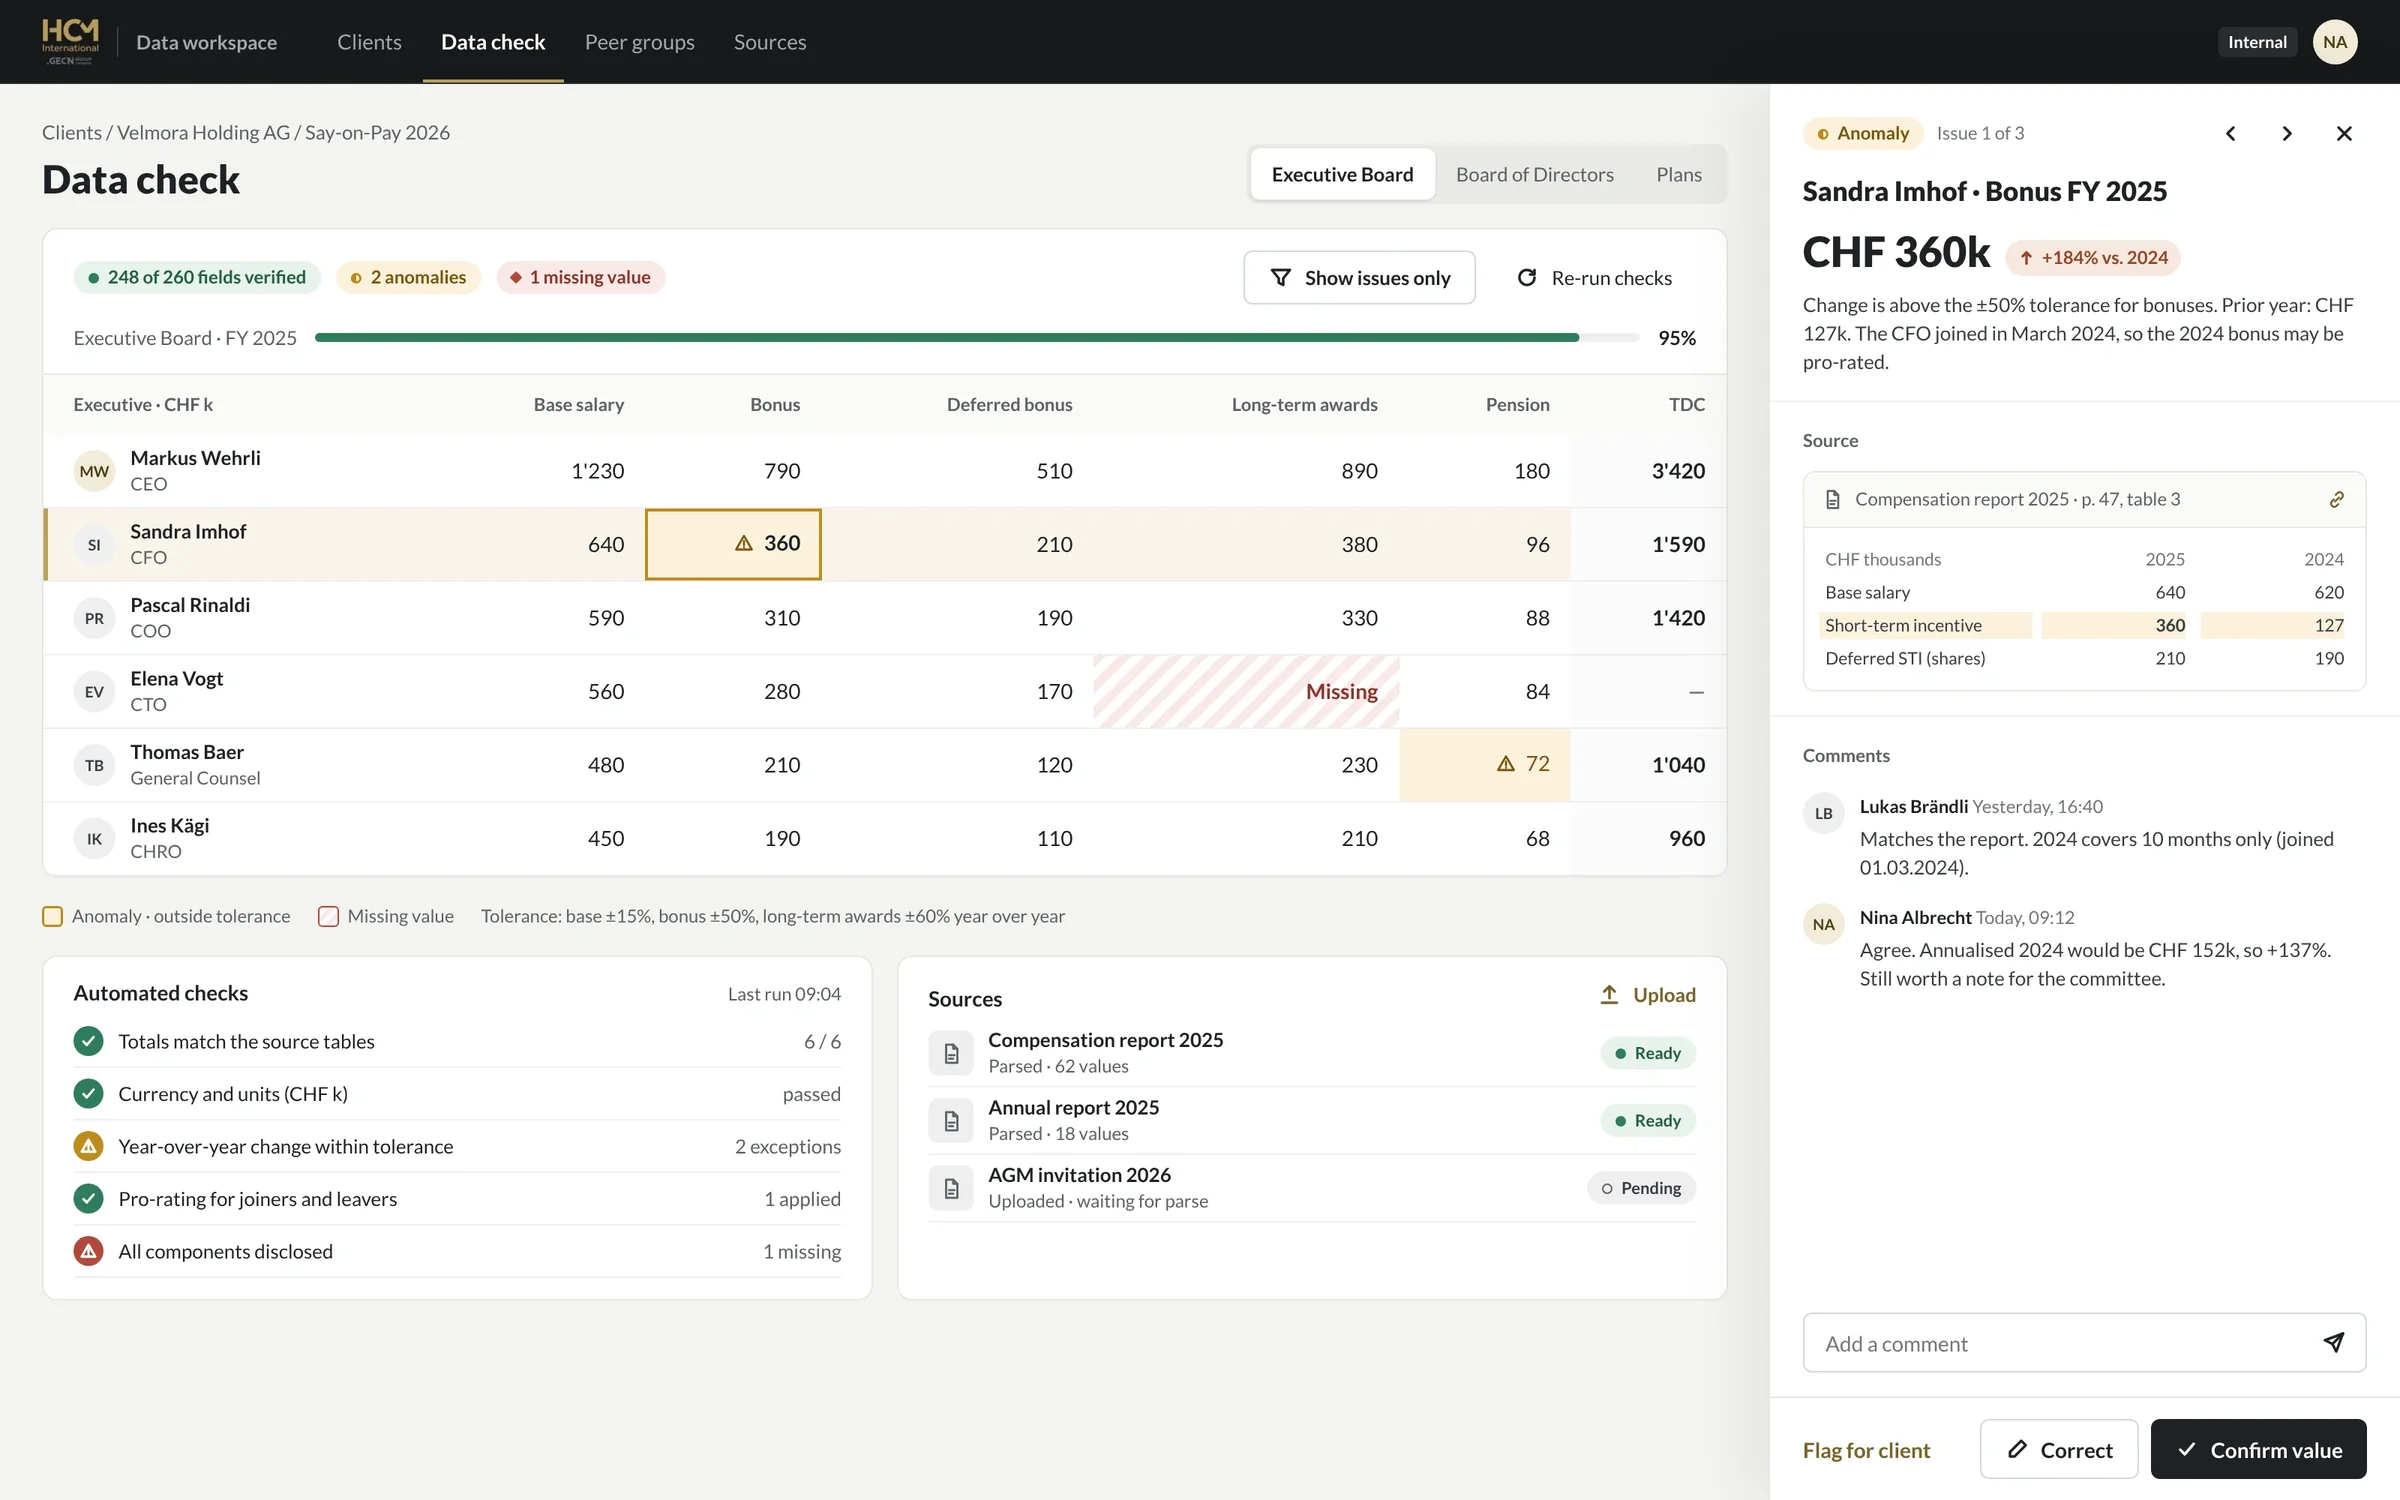
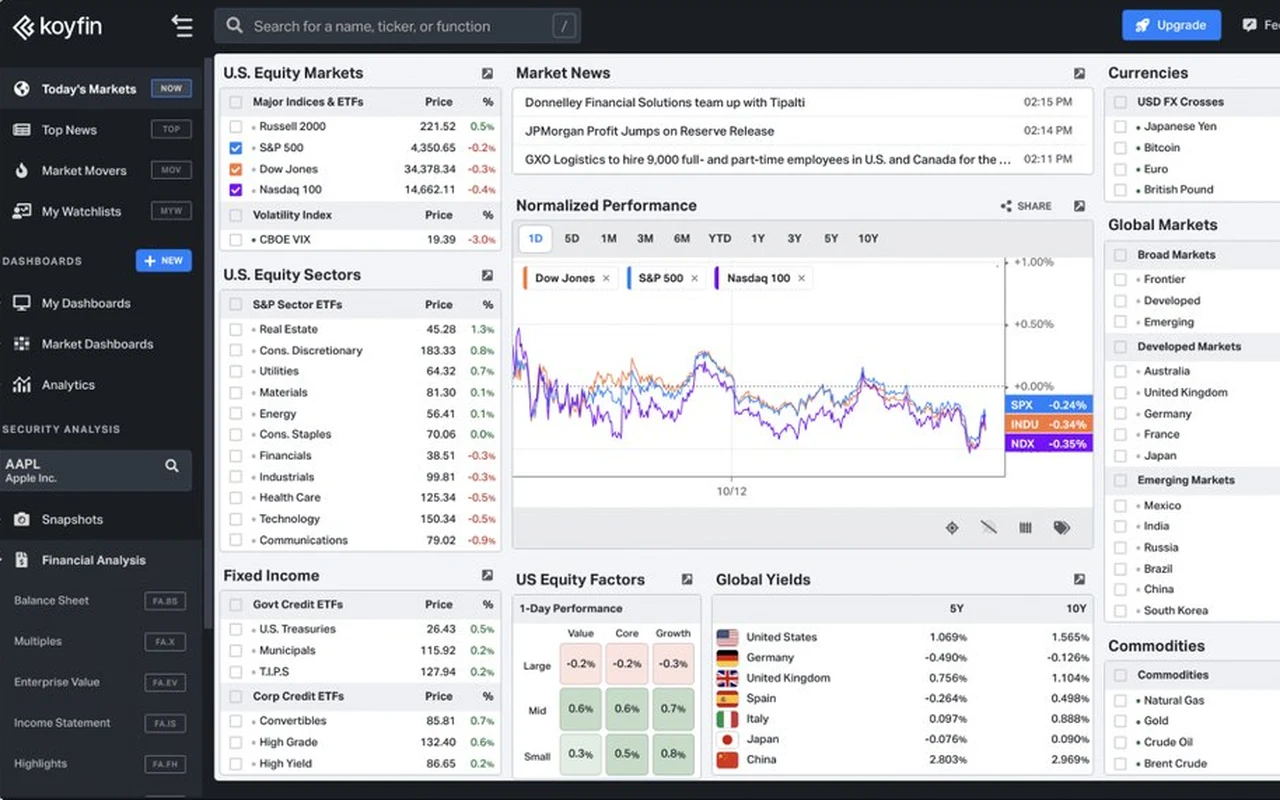
Because they show everything the database has instead of answering what the user came to ask. The fixes are rarely new charts; they are hierarchy, real data and the states nobody designed.
Twelve equal cards, so nobody knows where to look first.
Instead: One headline number per question at the top, with a comparison; details below or one click away.
Seven colours, a legend at the bottom and a title that names the metric, not the question.
Instead: Direct labels, fewer series, and titles that state the question each chart answers.
Real names are longer, values go missing and accounts have 10,000 rows.
Instead: Wireframes built from your real exports, with rules for truncation, nulls and units.
Slow queries, empty accounts and missing permissions show broken or blank widgets.
Instead: Loading, empty, error, partial-data and no-access states for every widget.
Answer six questions about your current dashboard. Anything you mark “No” or “Not sure” shows up with the fix we would start with. Nothing is sent anywhere; it runs in your browser.
Start from the question, not the chart type. Most dashboards need four things: a number with a comparison, a line for trends, a sorted bar for comparisons and a table for exact values. Maps, gauges and pies earn their place far less often than they appear.
| The user asks | Use | Avoid |
|---|---|---|
| Is it on track? | A number with target and change, such as $1.2M, 82% of target, +6% on last month | Gauges and speedometers |
| How is it trending? | A line chart with one to five series, labelled at the line ends | Ten lines in rainbow colours, 3D charts |
| How do these compare? | A bar chart sorted by value, one colour plus a highlight | Unsorted bars, dual axes |
| What is the share? | A stacked bar, or one percentage when there are two parts | Pies with more than four or five slices |
| Where is it? | A map, only when location changes the decision (wells, sites, regions) | Maps for data that isn’t spatial |
| What is the exact value? | A sortable table with tabular figures and right-aligned numbers | Charts used for look-ups |
| What changed and why? | An annotated line or a list of the biggest movers | A new chart for every dimension |
Our working rules from ComboCurve, Koyfin and HCM; your users’ questions come first.
Six checks from WCAG 2.2, applied to charts, tables and filters. Accessible dashboards are also easier for everyone to read: higher contrast, direct labels and keyboard paths help power users as much as anyone. If you sell banking or e-commerce services to consumers in the EU, the European Accessibility Act has applied since 28 June 2025.
| Check | WCAG 2.2 | On a dashboard |
|---|---|---|
| Text contrast | 1.4.3 · AA · 4.5:1, or 3:1 for large text | Axis labels, legends, table text and tooltips, grey secondary text included |
| Chart contrast | 1.4.11 · AA · 3:1 | Lines, bars, points and focus rings against their background |
| Not colour alone | 1.4.1 · A | Series also differ by label, marker, pattern or position; status never only red or green |
| Reflow | 1.4.10 · AA · 320 CSS px | Cards and filters reflow on phones; data tables may scroll sideways, which WCAG allows |
| Keyboard | 2.1.1 · A | Filters, tabs, tooltips and drill-downs work without a mouse |
| Text alternative | 1.1.1 · A | Each chart has a short summary or a table view of its data |
Success criteria from the W3C’s Understanding WCAG 2.2 pages. Checked 6 November 2026.
In six steps, starting from your users’ questions and your real data. Large platforms go through the same loop one module at a time, so you ship improvements every few weeks instead of waiting for a relaunch.
Interviews with the people who use the dashboard, plus exports of your real data.
You get: the questions each screen must answerQuestions mapped to views, roles, filters and drill-downs.
You get: a map of screens and who sees whatLongest names, empty values and large accounts tested from the first sketch.
You get: clickable wireframesFinal screens in light and dark, with loading, empty, error, partial and no-access states.
You get: final screens in FigmaTokens, data components, number formats and chart rules for your library.
You get: a library your engineers build fromWe build in React or review your team’s build against the spec, then measure.
You get: a release checked against the designA product project starts at $12k and takes 6–10 weeks; a design system starts at $15k; a design partnership for teams shipping every month starts at $6k a month. Need it built too? React front-ends and web apps start at $25k, in 8–14 weeks, on the web development page.
A dashboard or a module redesigned on real data, with every state and the specs to build it.
Tokens, data components, number formats and chart rules in Figma and code.
A senior team on your product every month, module by module.
| Who designs it | Scope | Price | Time | Source |
|---|---|---|---|---|
| Market range | Focused dashboard, 5–10 screens | $8,000–15,000 | 2–4 weeks | Airform, 29 September 2026 |
| Market range | MVP SaaS dashboard with core flows | $15,000–40,000 | 4–8 weeks | Airform, 29 September 2026 |
| Market range | Complex data platform, many views and roles | $40,000–100,000+ | 2–4 months | Airform, 29 September 2026 |
| US specialist agency | Full product design engagement | $40,000–150,000 | Not stated | Fuselab Creative, updated 7 October 2026 |
| Market range | Ongoing design partner | About $5,000–15,000 a month | Ongoing | Airform, 29 September 2026 |
| DIXI | Product project · design partner | From $12k · from $6k a month | 6–10 weeks · from 3 months | This page |
Prices as published by each source. For a range on your own scope, try the cost calculator. Checked 6 November 2026.
When the dashboard is an internal BI report built in Tableau, Power BI or Looker by your analysts, or when you need a single chart for a pitch deck. We design product UI where data is part of what customers pay for, and we work best next to the engineers who build it.
Working on a whole product, not only the dashboard? See SaaS product design and enterprise SaaS UX.

I’m Ignat. I have designed data-heavy products for more than ten years: 3.5 years inside ComboCurve’s product team, two years inside Koyfin’s while it grew from 100K to 300K+ investors, and the redesign of HCM International’s reporting platform. You work with me and a senior team of seven, next to your engineers, not with an account manager.
It designs the screens where people read and act on data: analytics dashboards, reporting platforms, internal tools and customer-facing analytics. That covers which questions each screen answers, the charts and tables that answer them, every state from loading to no-access, and the design system and chart specs engineers build from.
With us, a product project starts at $12k and a design partnership at $6k a month. Published market ranges run from $8,000–15,000 for a focused dashboard of 5–10 screens to $40,000–100,000+ for a complex data platform (Airform, September 2026). The final price depends on the number of views, user roles and data states.
A product project takes 6–10 weeks from kickoff to final screens and specs; a design system adds 6–10 weeks when it runs on its own. Large platforms are redesigned module by module, the way we worked inside ComboCurve’s product team for 3.5 years, so nothing waits for a big-bang relaunch.
Yes. We build React front-ends and web apps from $25k, in 8–14 weeks, or design next to your engineers and review their build against the spec. See web development.
The one your engineers can keep fast with your data volume. For React products, Recharts or Visx cover most dashboards; ECharts and Highcharts handle large datasets and many chart types; D3 suits custom visuals. We write the chart specs for the library you choose, so design and code match.
With your real exports, not tidy sample data. At ComboCurve that meant tables with thousands of wells, missing values, long well names, mixed units and ten scenarios side by side; every rule for truncation, empty values and units went into the design system.
Yes. We start with the flow that costs users the most time, ship it, measure it and move to the next. HCM International went from eight steps across four tools to four steps in one platform, and 22% more users reached a finished report.
Yes, to WCAG 2.2 AA: 4.5:1 contrast for text, 3:1 for chart lines, bars and focus rings, no meaning carried by colour alone, keyboard access for filters and drill-downs, and a summary or table view for each chart.
Yes, when people check data on the go. We designed Koyfin’s mobile app from the first screen, with market data, watchlists and charts sized for a phone, and made HCM’s reports usable on a phone with bottom-sheet filters and wide tables adapted for small screens.
Yes. We extend it with data components such as KPI cards, chart rules and table patterns, or build one from $15k if there is none. See design systems.
Book a 25-minute call with Ignat and share a few screens. You get a written plan of what to change first and a fixed quote. Ignat replies within one business day.
We use essential storage to run this site. With your OK we also use analytics to see which pages help visitors. No ad tracking. Cookie policy
Choose what we can use. You can change this any time from Cookie settings in the footer.