On this page
- The short answer
- Why engineers stay
- ARIES, PHDwin, Excel, cloud
- Step 1: Reconcile their numbers
- Step 2: Run both for a cycle
- Step 3: Their structure and words
- Step 4: Expert speed
- Step 5: Inspectable automation
- Step 6: Bridges to Excel
- Step 7: What the old tool can't do
- Which workflow first
- A 90-day plan
- What to track
- Seven mistakes
- What the website shows
- Glossary
- Checklist
- FAQ
- How we put this together
- Sources
The short answer
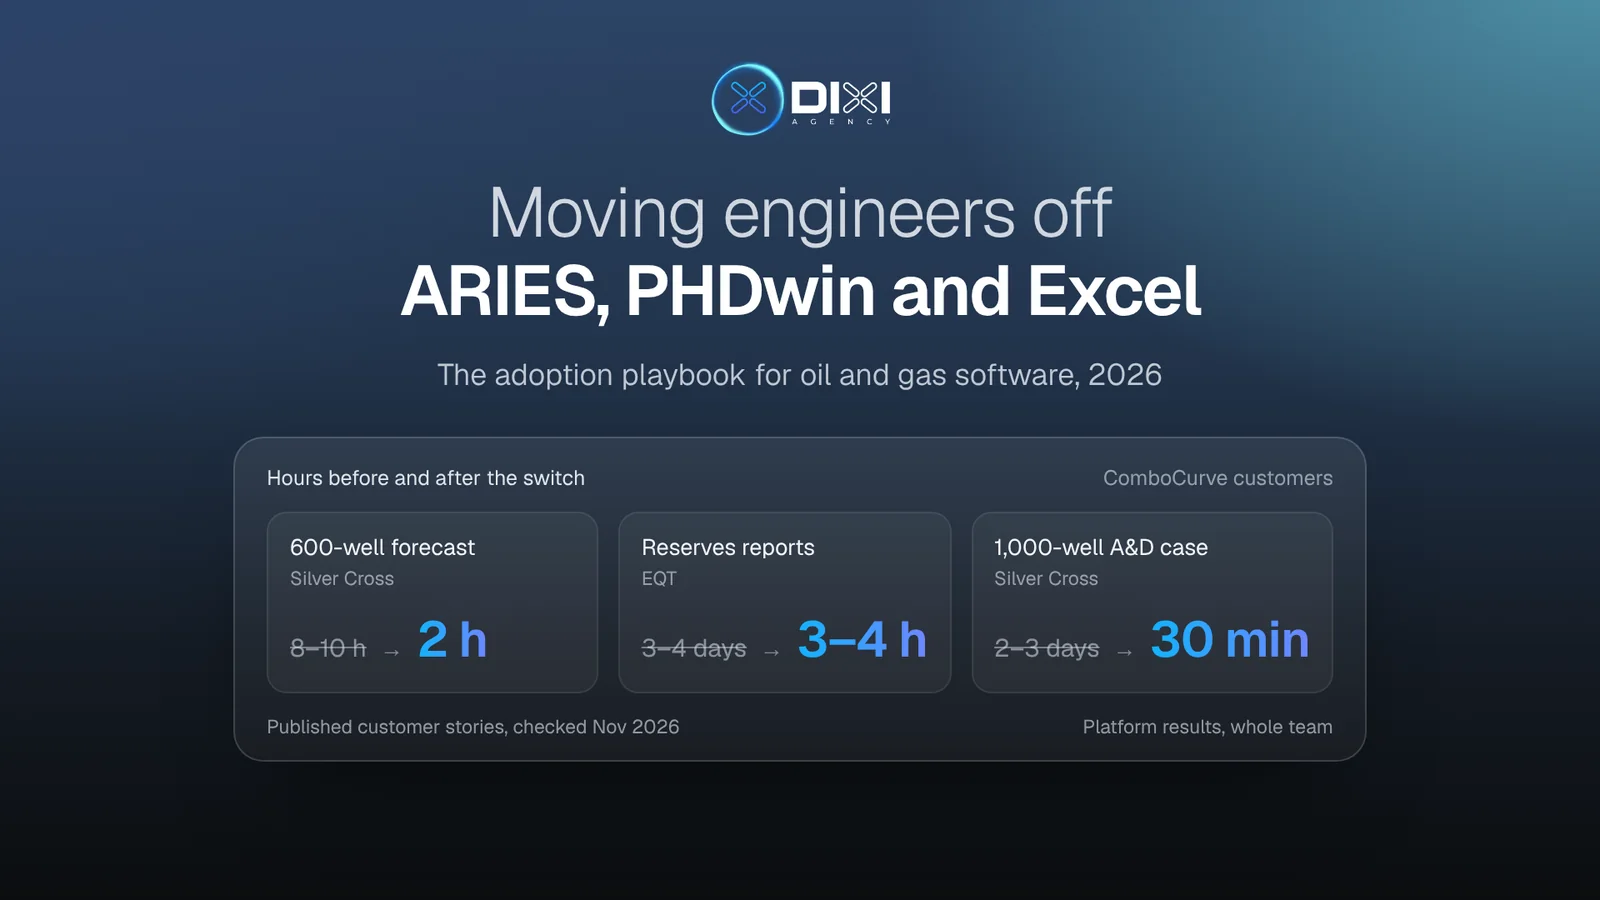
Engineers leave ARIES, PHDwin or a spreadsheet only when three things are true: the new tool reproduces their numbers, it keeps the habits that make them fast, and it saves time on a job they do every month. Most switches stall on the first. A reserves total doesn't match the old tool, and nobody can see why. So the playbook is to import their data and reconcile it line by line, run both tools for one reporting cycle, keep their structure and their words, and keep the bridges to Excel. Every automated result has to be inspectable. Start with one high-volume job, such as forecasting hundreds of wells. That's where the time saved shows first. At Silver Cross Energy Partners, forecasting 600 wells took 8–10 hours in ARIES and 2 hours at most in ComboCurve.
| What engineers rely on | What the new tool must do on day one | Where switches stall |
|---|---|---|
| Their numbers: reserves, EUR, NPV | Import the project and reconcile results with the old tool, well by well | A total that doesn't match, with no way to trace the difference |
| Cases, scenarios and qualifiers | The same structure and the same words | Renamed concepts and a new mental model to learn |
| Keyboard speed and dense grids | Shortcuts, bulk edits, paste from Excel | A mouse-first interface that slows experts down |
| Company price decks and assumptions | Shared, versioned decks the whole team uses | Every engineer re-entering assumptions by hand |
| Excel, Spotfire and Power BI | Exports and imports both ways, and an API | No way to feed the reports the team already runs |
| Review before a reserves audit | A change history: who changed what, when and why | Edits nobody can trace |
We're DIXI, a founder-led design studio. For 3.5 years we worked inside the product team of ComboCurve, the cloud platform that 400+ energy companies use for forecasting, economics and scheduling. We designed features across forecasting and type curves, economics, scheduling and the map, next to its engineers, developers and in-house designer. Several of ComboCurve's published customer stories are about leaving ARIES. This playbook is for the teams building the next tool engineers are asked to switch to. The customer results quoted here are ComboCurve's published results, the work of its whole team.
- Weeks 1–2Import and map
Bring in one real ARIES, PHDwin or CSV project. Map fields once and keep the mapping.
- Weeks 3–6Reconcile
Totals side by side, well by well. Every difference gets a cause or a fix.
- One reporting cycleRun both
Year-end reserves or a borrowing-base redetermination in both tools, with a difference log.
- After sign-offMove the next workflow
Retire the old copy for that workflow, then pick the next frequent, slow job.
Why don't engineers leave ARIES, PHDwin or Excel?
Because the old tool is wired into everything that matters: reserves reports, the bank's borrowing base, acquisition decisions and years of company assumptions. Engineers have used ARIES since the late 1980s, and PHDwin's maker started in 1986. A reserves number feeds an audit or a loan. A tool that can't prove its numbers match is a risk to them, not an upgrade.
- The numbers decide money. Banks lending to producers set the borrowing base from an engineering reserve report and, as the US bank regulator's handbook describes, redetermine it once or twice a year. Public companies disclose proved reserves under SEC rules, last modernized in 2008, and third-party reserve engineers often check the numbers.
- Whole processes are built around the tool. Leslie Armentrout, CEO of Silver Cross Energy Partners, described five processes that all ran on ARIES, with all the source data inside it. She called taking ARIES out of an organization "near impossible", before her team did it.
- Muscle memory. Power users know the case structure, the qualifiers that switch economic assumptions, and the shortcuts by heart. A new tool that is easier for a beginner can still be slower for them.
- Excel is the glue. Custom analysis, charts for management and hand-offs between teams often happen in spreadsheets and Spotfire. A tool that cuts those bridges makes extra work.
- Automation looks like a black box. An auto-forecast across thousands of wells is only useful if the engineer can see why a curve looks the way it does and override it.
ARIES, PHDwin, spreadsheets and cloud platforms: what each is for
ARIES and PHDwin are the long-established desktop tools for reserves, decline curve analysis and economics. Spreadsheets fill every gap between them. Cloud platforms such as ComboCurve put the same jobs in a shared browser workspace. A new tool doesn't replace one product; it replaces a habit that spans several.
| Tool | Where it comes from | How it runs | What engineers rely on it for | Risk when switching away |
|---|---|---|---|---|
| ARIES | Halliburton, in use since the late 1980s | Desktop, and a cloud app in Halliburton's DecisionSpace 365 | Reserves, forecasts and economics, often the company's system of record | Years of projects, qualifiers and macros wired into reporting |
| PHDwin | TRC Consultants, founded 1986; now version 3 | Desktop | Reserves, decline curves and economics, common with consultants | Results that auditors and partners already accept |
| Excel and Spotfire | General-purpose tools | Desktop and shared files | Custom analysis, management charts, hand-offs between teams | Reports that break when the source changes |
| Cloud platforms | ComboCurve, for example, launched in 2020 | Browser, shared projects | Forecasting at scale, economics, scheduling and collaboration in one place | Trust: proving that the numbers match the old tool |
The work itself is the same in every tool: load production history, fit a decline curve or a type curve to each well, forecast future production, apply prices, costs, ownership and taxes, and roll the cash flows up into reserves and value. What changes is where that work lives and who can see it. That's why the switch is less about features and more about trust, speed and the team.
Step 1: Import their data and reconcile it, well by well
The first session decides the switch. If an engineer imports a project and the totals match the old tool, or every difference has a visible reason, they keep going. If the totals are off and nothing explains why, they go back to ARIES and tell their team the new tool is wrong.
Getting data in is the easy half. ComboCurve, for example, documents a free manual import from ARIES, PHDwin and CSV files, a conversion team that helps configure it, and an automated sync service. PHDwin offers its own ARIES conversion. The hard half is showing that the numbers agree. Design a reconciliation view as part of onboarding, not as a support task:
- Totals by well, case and scenario side by side: old tool, new tool, difference.
- Differences sorted by size, with a drill-down to the input that differs: price deck, economic limit, decline parameters, ownership or timing.
- A tolerance the team sets, so small rounding differences don't hide real ones.
- Data problems flagged before any calculation. Silver Cross's CEO liked seeing which wells had missing data, marked red or yellow, before she trusted a run.
| Well | ARIES EUR | New EUR | Diff | Cause |
|---|---|---|---|---|
| Well 0412H | 612.4 | 599.6 | −2.1% | Price deck |
| Well 0388H | 540.2 | 533.1 | −1.3% | Economic limit |
| Well 0291H | 701.9 | 708.0 | +0.9% | b-factor |
| Well 0175H | 455.0 | 455.3 | +0.1% | Within tolerance |
| Well 0066H | 389.7 | 372.0 | −4.5% | Review |
- ARIES
- Flat $70/bbl
- New tool
- Strip, Nov 2026
- Effect on EUR
- −2.1%
Step 2: Run both tools for one reporting cycle
Don't ask a team to switch in the middle of a reserves cycle. Plan for both tools running side by side until one full cycle closes, such as a year-end reserves report or a borrowing-base redetermination. Then the team has proof on the work that matters most.
- Agree before the cycle starts what "matches" means: which totals, at what tolerance.
- Make exports from the new tool look like the reports reviewers and banks already receive, so the comparison is easy.
- Keep a log of every difference and its cause. That log becomes the team's argument for switching, written in their own numbers.
- Name an internal champion per asset team. The reconciliation is easier to accept from a colleague than from a vendor.
Step 3: Keep their structure and their words
Copy the mental model, not the screens. Engineers think in cases, scenarios, qualifiers, price decks and economic limits, and in their own units. A new tool that renames those concepts to sound friendlier makes the switch harder, because every engineer has to translate in their head.
- Keep the vocabulary: case, scenario, qualifier, price deck, working interest and NRI, EUR, b-factor, P10/P50/P90.
- Keep the units and their formats: bbl/d, Mcf/d, $/bbl, and the decimals engineers expect for each.
- Keep the hierarchy they know, from company to project to well, and let them find a well the way they always have, by name, API number or header.
- Where the new tool does something genuinely different, name it plainly and show the old equivalent next to it the first few times.
Step 4: Be faster for experts, not only easier for beginners
The people you need to win over are the power users, and they judge a tool by how fast they can work in it. Design the expert path first: keyboard shortcuts, bulk edits in dense grids, paste from Excel, and saved configurations, at the scale of a full asset.
- Every frequent action has a shortcut. ComboCurve's public docs, for example, describe manual forecast editing with keyboard shortcuts.
- Tables work at the real count. ComboCurve auto-forecasts up to 25,000 wells in minutes and runs economics on up to 75,000 at once, so selection, sorting and bulk edits have to stay usable at that size.
- Paste a block of values from a spreadsheet into a grid, and copy a grid back out, without a dialog in between.
- Charts and forms remember their settings, and teams can share them, so nobody sets up the same view twice.
Step 5: Make automation inspectable
Automation is the reason to switch, and the reason engineers hesitate. An auto-forecast across thousands of wells saves days only if the engineer can see which wells look wrong, why a curve has its shape, and change it. Keep the engineer in the loop: the tool writes the first draft, the engineer signs it off.
- Flag outliers and poor fits first, so review starts with the wells that need it.
- Show the fit parameters and the data behind every curve, one click from the chart.
- Let engineers compare an automated forecast with their own and merge the parts they prefer. ComboCurve documents this as Compare & Merge.
- Keep the original and every override, so a reviewer can see what the engineer changed.
Step 6: Keep the bridges to Excel, Spotfire and Power BI
Don't try to replace every spreadsheet on day one. Engineers will keep using Excel and Spotfire for custom analysis, and management reports often live in Power BI. Make data flow both ways, so the new tool becomes the source of truth while the old reports keep working.
- Exports in the formats the team already uses, including CSV and PDF reports that look like the ones reviewers expect.
- Imports that map columns once and remember the mapping.
- An API for the data team, so integrations don't depend on someone exporting by hand.
- Connectors for the reporting tools the company already pays for. ComboCurve, for example, offers Power BI reports alongside custom CSV and PDF reports.
Step 7: Give them something the old tool can't do
Matching the old tool earns trust. Switching needs a reason. For desktop tools, the clearest reason is the team itself: many engineers working on one project, a single source of truth, and a record of every change.
- One shared project. No more emailing databases or merging copies before a deadline. At SPE ATCE 2024, a Marathon Oil senior reservoir engineer described ComboCurve becoming the team's single source of truth for forecasting and type curves.
- A change history. Who changed which assumption, when and why. Silver Cross's CEO named this as one of the reasons she moved her team.
- Speed at scale. Running a full acquisition case in the time a meeting takes changes how a team evaluates deals.
- Time and space in one place. A schedule and a map that stay in sync answer "what happens where, and when" without a spreadsheet in between.
Which workflow should you move first?
Move the job that is frequent, slow and painful in the old tool, and visible to the people who approve budgets. For most teams that's forecasting a large set of wells, evaluating an acquisition, or producing the reserves report. These are also the jobs where ComboCurve's published customer stories report the biggest time savings.
| Company | Workflow | Before | After |
|---|---|---|---|
| Silver Cross Energy Partners | Forecasting 600 wells | 8–10 hours in ARIES | 2 hours at most |
| Silver Cross Energy Partners | Acquisition case, nearly 1,000 wells | 2–3 days | 30 minutes |
| EQT | Reserves reports | 3–4 days | 3–4 hours |
| Double Eagle | Evaluations | A week or two | A day or two |
| Arrington Oil and Gas | Evaluating prospects | Baseline | 60–70% less time |
Pick one of these for the first month and make it clearly faster. A team that sees a forecast take an afternoon instead of two days asks to move the next workflow itself.
What does a 90-day switch plan look like?
Plan the switch around the team's reporting calendar, not the vendor's release plan. Three months is enough to import, reconcile and run one high-volume workflow in parallel, if the reporting cycle falls inside that window. Here's the plan we'd suggest to an energy software team onboarding its first asset team.
| When | Engineers do | Your product and team do | Done when |
|---|---|---|---|
| Weeks 1–2 | Export one real project; name a champion per asset team | Import, map fields, flag missing data | The project opens with every well and assumption |
| Weeks 3–6 | Agree the tolerance; review the differences | Reconciliation view, a cause for each difference | No difference without a cause |
| Weeks 7–10 | Run the chosen workflow in both tools | Exports that match the old reports; shortcuts for their frequent actions | The new tool is faster on the chosen job |
| Weeks 11–13 | Sign off the cycle; retire the old copy for that job | Difference log as a one-page summary for managers | The team asks to move the next workflow |
How do you know the switch is working?
Count where the work happens, not how many people logged in. A switch is working when evaluations are run in the new tool, exports back to Excel fall, reconciliation differences shrink to explained ones, and the time per report goes down.
- Share of evaluations and forecasts run in the new tool, by asset team
- Exports back to spreadsheets per week. They should fall, not disappear
- Open reconciliation differences, and how many have no explained cause
- Time to produce the reports the team already sends
- Active users per asset team, not per company
- Support questions that start with "the numbers don't match"
Seven mistakes that stall a switch
Most stalled switches fail for the same few reasons, and none of them is a missing feature. They're about trust, timing and who the product was designed for.
- Demoing on sample data. Engineers trust a tool when it shows their own wells. Import their project before the second meeting.
- Hiding the differences. A total that's 2% off with no explanation ends the trial. Show every difference and its cause.
- Switching mid-cycle. Asking a team to move during year-end reserves guarantees a no.
- Renaming their concepts. Friendly labels for cases, qualifiers or price decks make engineers translate in their heads.
- Designing for the beginner only. Wizards and empty space slow down the power users who decide.
- Cutting the bridges. If the Excel and Spotfire reports stop working, the team rebuilds them by hand and blames the new tool.
- Measuring logins. Logins rise in the first week whether the switch is working or not. Count the work done in the new tool.
What should your website show engineers evaluating a switch?
Engineers read a software website like a reserves report: they look for proof. Show the real product with real units, how migration from ARIES or PHDwin works and how long it takes, side-by-side results from a customer who switched, security and data ownership, and a way to try it on their own data.
- A migration page: what imports, who helps, what "matching" means, and a typical timeline.
- Customer results in hours saved on named workflows, like the ones above.
- Product screens with real units and dense tables, not marketing illustrations.
- A next step that isn't only "Book a demo": a sandbox, a recorded walkthrough, or a reconciliation of their own project.
For the full picture of energy software websites, see our oil and gas software design page. For what stops buyers in the last step, see Why B2B websites fail to convert high-intent traffic.
Glossary: the words engineers expect to see
Use the engineers' own vocabulary in the product, the onboarding and the website. These are the terms a reserves and economics tool should use exactly as engineers do.
- Decline curve analysis (DCA)
- Fitting a curve to a well's production history to forecast future production.
- Type curve
- A representative production profile built from a group of similar wells, used for wells not yet drilled.
- b-factor
- The exponent in the Arps decline equation that sets how quickly the decline rate flattens.
- EUR
- Estimated ultimate recovery: the total a well is expected to produce over its life.
- 1P, 2P, 3P
- Proved; proved plus probable; proved plus probable plus possible reserves, as defined in SPE's PRMS.
- PUD
- Proved undeveloped reserves: locations not yet drilled that meet the proved standard.
- Case, scenario, qualifier
- How economics tools organise alternatives: a well's case, a set of assumptions, and switches between them.
- Price deck
- The oil, gas and NGL price assumptions over time, flat or following the futures strip.
- Working interest and NRI
- The share of costs a company pays, and the share of revenue it keeps after royalties.
- Economic limit
- The point where a well's revenue no longer covers its operating cost, which ends its reserves.
- Borrowing base
- The amount a bank will lend against a producer's reserves, set from the reserve report.
- A&D
- Acquisitions and divestitures: buying and selling producing assets, which needs fast evaluations.
Switch-readiness checklist
- An ARIES, PHDwin or CSV project imports without a support ticket.
- A reconciliation view shows totals side by side and drills to the input that differs.
- The team has agreed what "matches" means, and at what tolerance.
- The case, scenario and qualifier structure and the units are the engineers' own.
- Every frequent action has a keyboard shortcut, and grids accept paste from Excel.
- Tables and bulk edits stay usable at the size of a full asset.
- Automated forecasts show outliers, fit parameters and overrides.
- Exports match the reports reviewers and banks already receive.
- Every change to an assumption records who, when and why.
- One high-volume workflow is clearly faster than in the old tool.
FAQ
Why do petroleum engineers resist switching from ARIES?
Because ARIES is wired into reserves reports, bank borrowing bases and years of company assumptions, and engineers know it by heart. A new tool has to prove its numbers match, keep their structure and shortcuts, and save time on a frequent job before they'll trust it with work that decides money.
What is the difference between ARIES and PHDwin?
Both are long-established reserves, decline curve and economics tools. ARIES is Halliburton's and has been in use since the late 1980s; Halliburton now also offers it as a cloud app in DecisionSpace 365. PHDwin comes from TRC Consultants, founded in 1986, and is now at version 3. Each vendor publishes its own comparison and conversion guides.
What is the best alternative to ARIES?
It depends on what the team needs most. PHDwin is the long-established desktop alternative for reserves and economics. Cloud platforms such as ComboCurve add shared projects, forecasting at scale and scheduling in the browser. Whatever you choose, test it on one of your own projects and reconcile the results with ARIES before you decide.
Is ARIES available in the cloud?
Halliburton offers ARIES as an application in its DecisionSpace 365 cloud suite, alongside the desktop version many teams still run. Moving ARIES to the cloud keeps the same model; moving to a cloud-native platform changes how teams share and review work.
What is decline curve analysis software?
Software that fits curves to a well's production history to forecast its future production and estimate its EUR. Reserves and economics tools such as ARIES, PHDwin and ComboCurve combine it with prices, costs and ownership to calculate reserves and value.
Can you import ARIES or PHDwin data into a cloud platform?
Usually, yes. ComboCurve, for example, documents a free manual import from ARIES, PHDwin and CSV files, a conversion team and an automated sync service. PHDwin offers conversion from ARIES. The import is the easy part; proving the results match is what decides the switch.
How long should old and new tools run in parallel?
At least one full reporting cycle that matters to the team, such as a year-end reserves report or a borrowing-base redetermination, which banks usually run once or twice a year. Agree in advance which totals have to match and at what tolerance.
Should a new oil and gas tool copy the ARIES interface?
No. Copy the structure and the vocabulary, such as cases, scenarios, qualifiers, price decks and units, not the screens. Engineers need to recognise their model of the work, then find the new tool faster for the jobs they do most.
How do you get engineers to trust automated forecasts?
Show them where to look and let them change it. Flag outliers and poor fits first, show the fit parameters and data behind each curve, let engineers compare and merge their own forecast with the automated one, and keep every override in the history.
What should we measure to know adoption is working?
The share of evaluations run in the new tool per asset team, exports back to Excel per week, open reconciliation differences without a cause, time per report, and active users per asset team. Logins alone say little.
How we put this together
- Our experience: 3.5 years inside ComboCurve's product team, designing features across forecasting and type curves, economics, scheduling and the map. The playbook is our view; it doesn't describe ComboCurve's internal process, and no customer data is used.
- Customer results: ComboCurve's published case studies and blog (Silver Cross Energy Partners, EQT, Double Eagle, Arrington Oil and Gas), and a Marathon Oil talk at SPE ATCE 2024, all as published by ComboCurve. Checked on 7 November 2026.
- Product capabilities: ComboCurve's public product pages, help centre and blog. Mentioning a feature doesn't mean DIXI designed it.
- Lending: the US Office of the Comptroller of the Currency's handbook on oil and gas exploration and production lending (version 2.0, March 2016) and SCOR's note on reserve-based lending.
- Tools: Halliburton on ARIES, PHDwin's own pages on PHDwin V3 and ARIES conversion.
- Definitions: SPE's Petroleum Resources Management System (revised June 2018) for 1P, 2P and 3P, and the SEC's 2008 final rule on modernizing oil and gas reporting.
- The 90-day plan, the mistakes and the reconciliation view are our recommendations, drawn as concepts with sample data.
Sources
All pages opened on 7 November 2026.
- ComboCurve customer stories: From ARIES power user to ComboCurve champion (June 2024), Silver Cross case study, EQT case study, Double Eagle case study, Arrington Oil and Gas story, How Marathon Oil uses ComboCurve (SPE ATCE 2024)
- ComboCurve product: ComboCore forecasting, ComboCurve in 2025 (400+ companies)
- Data import: ComboCurve: which data integration solution is right for you (July 2024), ComboSync, PHDwin: ARIES to PHDwin V3 conversion
- Lending: OCC Comptroller's Handbook: Oil and Gas Exploration and Production Lending (PDF), SCOR: reserve-based lending and insurance (PDF)
- Tools: Halliburton: ARIES, PHDwin V3 FAQ, PHDwin: ARIES vs PHDwin, PHDwin on Capterra
- Definitions and rules: SPE: Petroleum Resources Management System (PDF, 2018), SEC: Modernization of Oil and Gas Reporting
- DIXI: ComboCurve case study, oil and gas software design, energy software design